LiveSolo+
Your prices
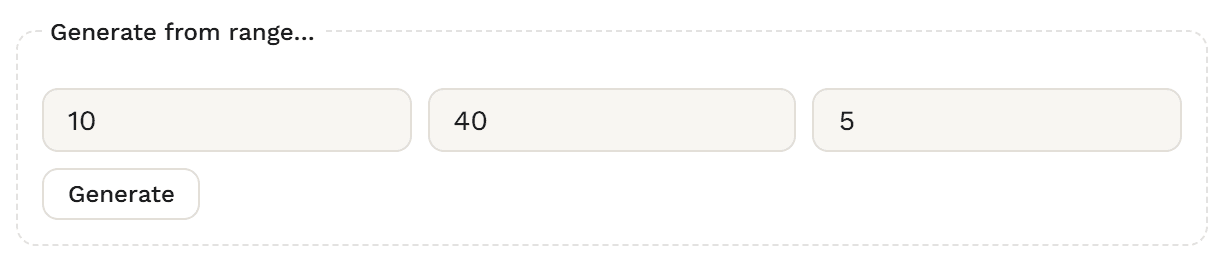
Type 2 to 15 prices, or generate them from a min, max and step. The list stays in price order.
Price ladder question · Advanced
Ask “would you buy it at this price?”, one price at a time. The adaptive ladder needs 3 questions to cover 7 prices. Results turns the answers into a demand curve, a revenue curve and the revenue-maximising price on your ladder, calibrated for over-claiming unless you turn it off.
Live demo
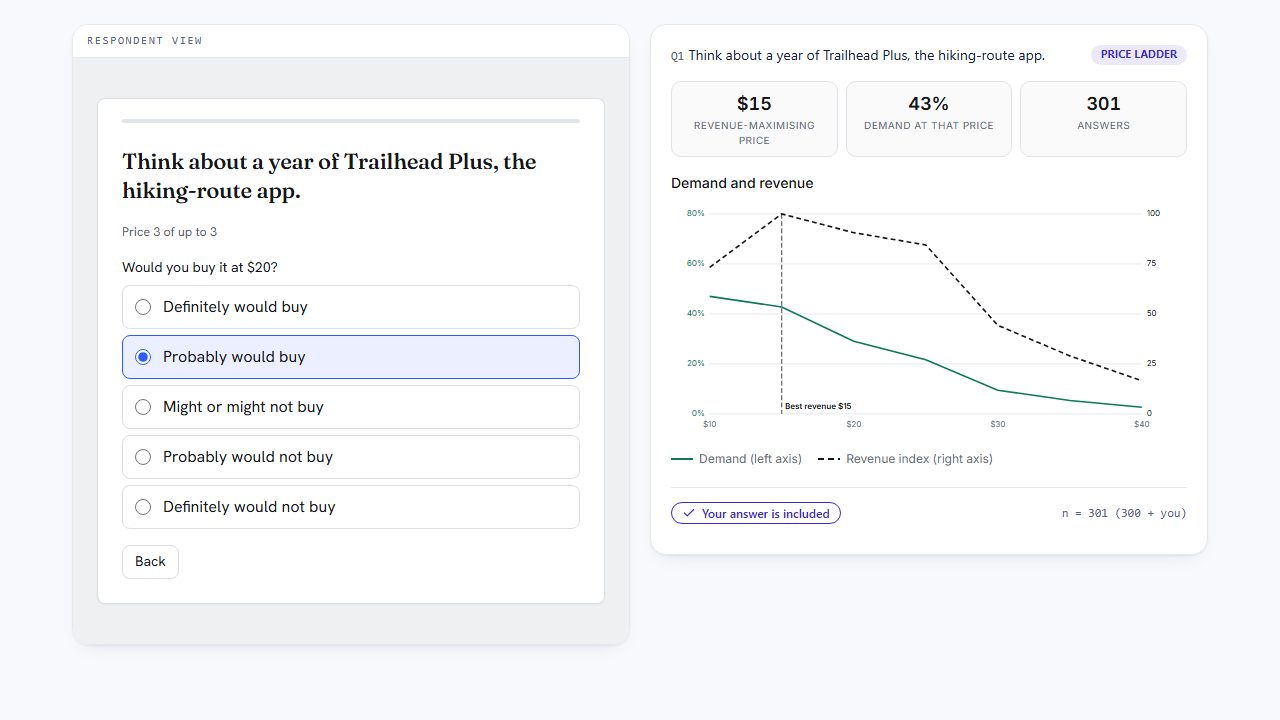
This is the question your respondents get. Rate each price, press Next, and see which price comes next. When the ladder ends, your answer is added to the demand and revenue curves beside it.
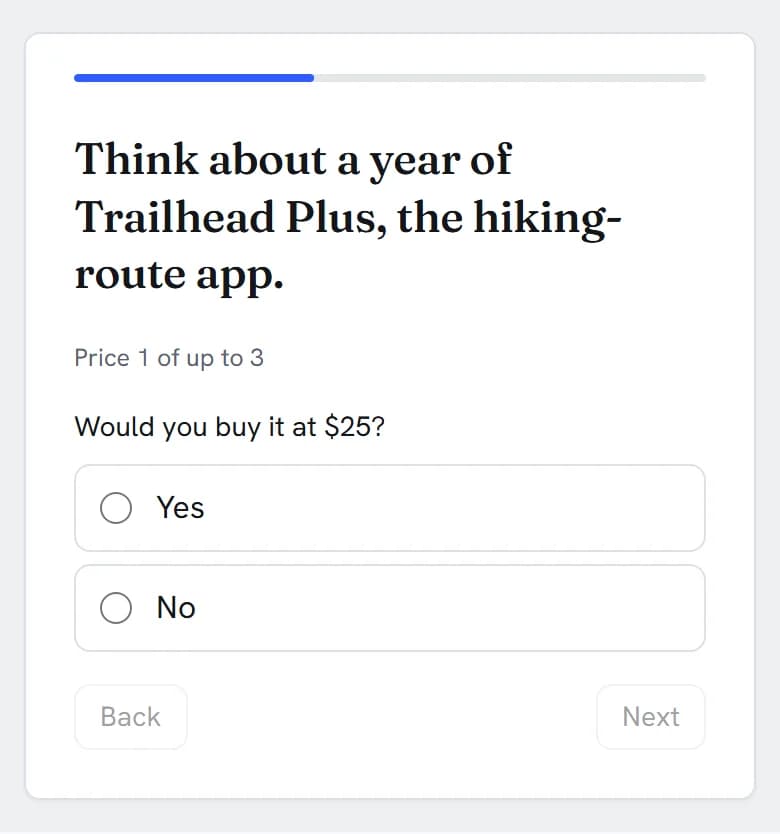
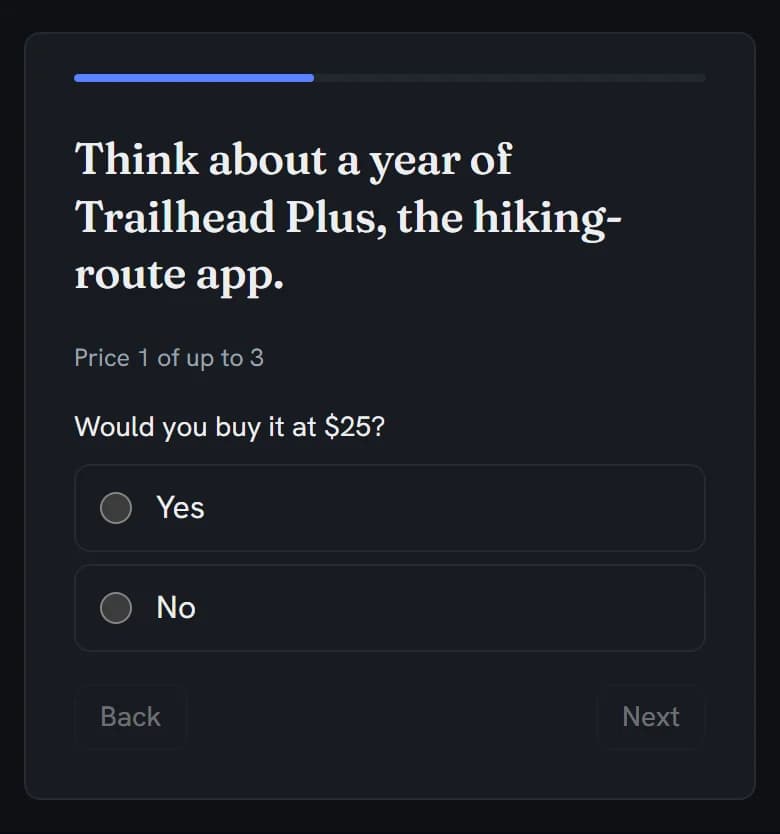
Think about a year of Trailhead Plus, the hiking-route app.
Price 1 of up to 3
Would you buy it at $25?
In action
Every feature
Your prices, your order, your scale. A ladder the server checks. Curves in Results, on dashboards and in decks, and a rating per price in your data.
Type 2 to 15 prices, or generate them from a min, max and step. The list stays in price order.
Pick USD, EUR, GBP, CAD, AUD or JPY, or type any three-letter code. Prices show in the survey language’s number format.
One currency per question: translations show the same prices.
Adaptive starts in the middle and halves the range. High → low stops at the first yes. Random order asks every price.
A 5-point likelihood scale where the top two or the top box counts as yes, or a plain Yes / No.
Count each answer as a chance of buying. The defaults are a starting point; change them or turn calibration off.
The chart doesn’t say a number is calibrated, so say so when you share it.
Edit the prompt and every choice label. {price} shows the price being asked. All of them translate.
A ladder that can’t work, such as one price or a prompt without {price}, can’t be saved or published. On a live survey, changing the prices, order, yes rule or calibration asks you to confirm first, and the answer scale can’t be changed.
A product description, a price meter, a price ladder, purchase frequency and an open question, ready to edit.
Replace the description and set your own prices before you launch.
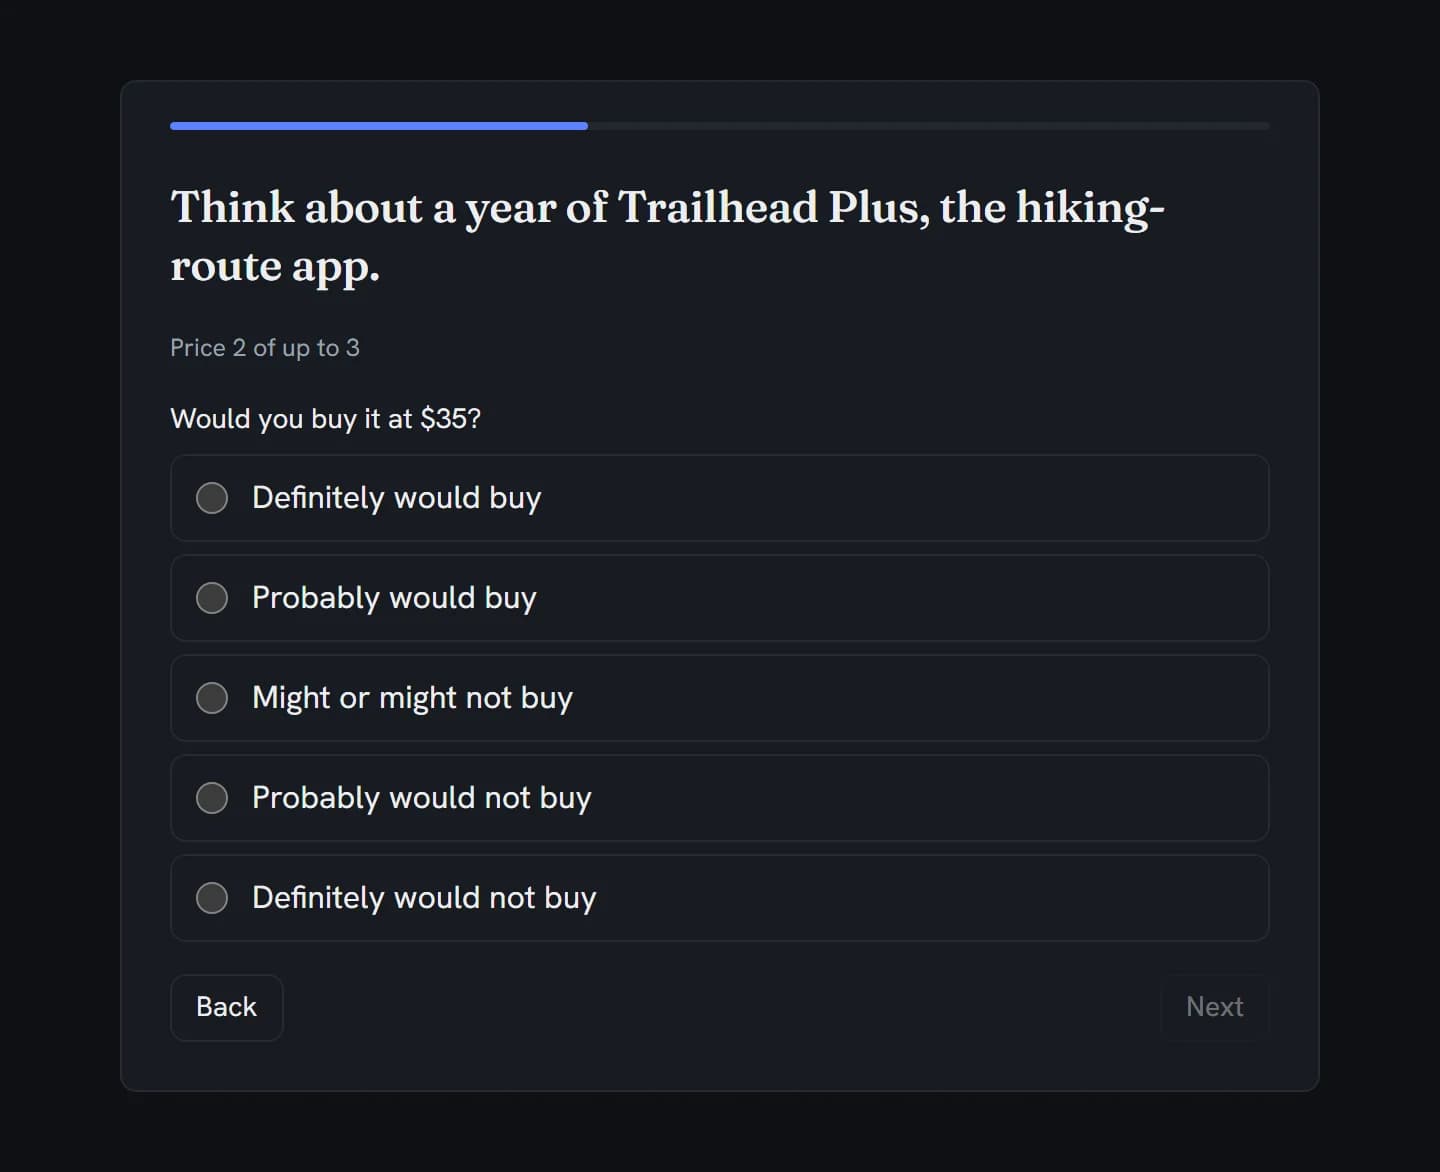
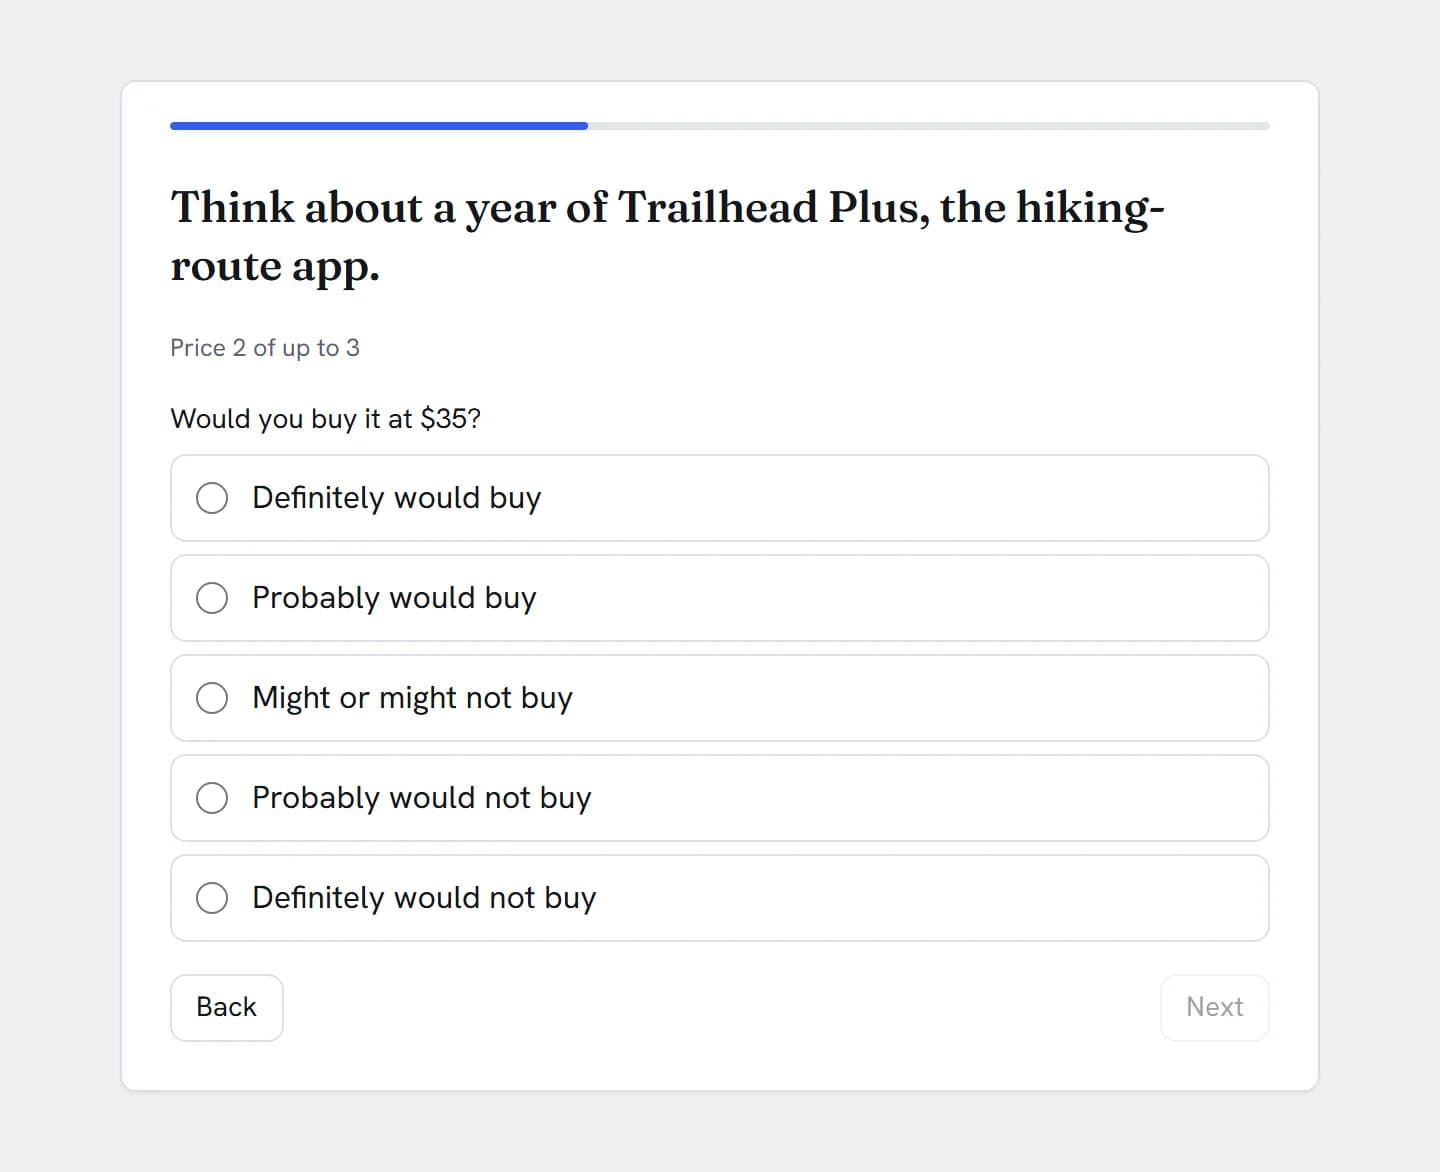
The question with its price, the choices, and Back and Next. “Price 2 of up to 3” shows how far along they are.
Back keeps the answer. Change it and the ladder asks the prices that now follow.
Every answer is replayed on the server against the ladder rule; a path that doesn’t fit is refused. If you edit a live ladder, anyone on it gets the new ladder, and answers it again if their path no longer fits.
Your prompt and labels translate, and the progress line and buttons come in six languages.
Choices and buttons follow the survey’s theme and dark mode.
Results charts demand and a revenue index at every price, and names the price on your ladder that earns most.
Revenue only: there are no costs or margins in it.
Filter Results on another answer, such as how often people buy, and the curves and the best price on your ladder are worked out for that group.
No significance test between groups yet.
An auto dashboard adds a price ladder tile, and you can add one with the tile editor; the board’s filters apply to it.
On the dashboard, Create shareable report builds a deck with a slide per ladder. It exports to PowerPoint, PDF and Excel, and you can share it to the client portal. The Excel sheet adds the highest-accepted-price table.
In Results, on dashboards and in decks, weights carry through to demand, revenue and the best price.
Each respondent’s own weight; a rake scheme doesn’t apply to price tiles.
The highest price accepted, then the rating at each price, as numbers. A price that wasn’t asked stays empty.
An empty highest-price cell means no to every price or no answer: the rating columns tell you which.
The highest price as a scale variable, each rating ordinal with the scale’s labels.
Not part of a price ladder yet: crosstabs and tab books, a significance test between groups, a Don’t know or Prefer not to say choice, and filters, branching or quotas on the price someone accepted. To compare groups, filter Results.
Choosing
Both are about what people will pay. A ladder tests prices you choose. A price meter lets people name their own.
Price is one feature among several? Use conjoint (Research Team). Ranking features with no prices? Use MaxDiff (Research Team).
Build it
In the builder, add a question and choose Price Ladder (Gabor-Granger) from the Advanced group. Describe the product in the question text, or in a Descriptive Text block just before it.
Type 2 to 15 prices, or use Generate from range… with a min, max and step. Pick the Currency, and Whole units or Cents.
Adaptive (up/down) starts in the middle and halves the range each time. High → low stops at the first yes. Random order asks every price.
Keep the 5-point likelihood scale, with the top two boxes counting as yes, or switch to Yes / No. Leave Calibrate the demand curve on to count “Probably would buy” as a partial yes (25%), or set your own numbers: the defaults are a starting point.
Keep “Would you buy it at {price}?” or write your own. {price} is replaced with the price being asked.
Preview it on a phone. Settle the prices, order and currency before you launch: Results reads every answer against the ladder as it is.


The data you get
Each ladder gets one column for the highest price the person accepted, then one column per price with the rating they gave there. A price they weren’t asked stays empty.
| respondent_id | Q1_wtp | Q1_p1$10 | Q1_p2$15 | Q1_p3$20 | Q1_p4$25 | Q1_p5$30 | Q1_p6$35 | Q1_p7$40 |
|---|---|---|---|---|---|---|---|---|
| 47762a85-0001-4000-8000-000000000001 | 10 | 4 | 2 | (empty) | 1 | (empty) | (empty) | (empty) |
| 47762a85-0002-4000-8000-000000000002 | 30 | (empty) | (empty) | (empty) | 4 | 4 | 3 | (empty) |
| 47762a85-0003-4000-8000-000000000003 | 40 | (empty) | (empty) | (empty) | 4 | (empty) | 4 | 4 |
| 47762a85-0004-4000-8000-000000000004 | 30 | (empty) | (empty) | (empty) | 4 | 4 | 3 | (empty) |
| 47762a85-0005-4000-8000-000000000005 | 20 | (empty) | 4 | 4 | 3 | (empty) | (empty) | (empty) |
| 47762a85-0006-4000-8000-000000000006 | 40 | (empty) | (empty) | (empty) | 4 | (empty) | 4 | 5 |
| 47762a85-0007-4000-8000-000000000007 | 35 | (empty) | (empty) | (empty) | 5 | (empty) | 5 | 3 |
| 47762a85-0164-4000-8000-000000000164 | (empty) | 2 | 1 | (empty) | 1 | (empty) | (empty) | (empty) |
Trimmed to the question’s columns. The price under each header is for reading here; the file holds the column name. Ratings run from 5 (Definitely would buy) to 1 (Definitely would not buy). Every export also carries the standard respondent columns.
Q1_wtp holds the highest ladder price the person said yes to, asked or worked out from the path. It’s empty if they said no to every price, and also if they didn’t answer: read the rating columns to tell the two apart.
Q1_p1 is the lowest price. Each holds the rating given at that price, or nothing if it wasn’t asked. Yes / No ladders hold 1 and 0.
Excel gets number cells, ready to sum or pivot. SPSS, on Professional+, gets labels for every rating.
Every export has a weight column: it holds 1, or each person’s weight when you export weighted, which is on Research Team.
Charts & analysis
Results charts every ladder for you: demand at each price, a revenue index, and the price on your ladder that brings in the most revenue. The same chart goes on dashboards and into report decks.
Think about a year of Trailhead Plus, the hiking-route app.Results · price ladder card · 300 answers
Calibrated, the default: Definitely would buy counts as 75% and Probably would buy as 25%. The best price on the ladder is $15.
The numbers behind the curvesShown here for reading; Results draws them as the curves and tiles
| Price | Demand, calibrated | Top-2 yes | Revenue index |
|---|---|---|---|
| $10 | 46.9% | 99.7% | 73.3 |
| $15 | 42.7% | 90.7% | 100.0 |
| $20 | 29.1% | 71.0% | 90.9 |
| $25 | 21.8% | 49.7% | 85.0 |
| $30 | 9.5% | 27.3% | 44.5 |
| $35 | 5.3% | 14.0% | 29.2 |
| $40 | 2.7% | 7.3% | 16.7 |
“Demand, calibrated” counts Definitely would buy as 75% and Probably would buy as 25%. “Top-2 yes” is the share whose answers put them at yes for that price, with calibration off. The revenue index, from the calibrated curve, is 100 at the best price. Results shows this as the curves and tiles; the calibrated numbers are in the deck’s Excel sheet.
Regular buyers pay moreResults, filtered on “How often do you buy products like this?”
Regular buyers answered “Weekly or more often” or “Monthly”; occasional buyers “A few times a year” or “Once a year or less”. Filter Results on another answer and the curves, tiles and best price on your ladder are worked out again for that group. There’s no significance test between two filtered groups yet.
Show the curves for one group, such as regular buyers, from the Results filter bar.
Add a price ladder tile, or let an auto-built dashboard add one, with the board’s filters applied.
On the dashboard, Create shareable report builds a deck with a slide per ladder. Download it as PowerPoint, PDF or Excel, or share it in the client portal.
Weights carry through to demand, revenue and the best price. Each respondent’s own weight counts; a rake scheme doesn’t apply to price tiles.
Highest accepted price, in the deck’s Excel sheetShare of answers whose highest yes is each price, or none
| Highest accepted price | Share (%) |
|---|---|
| 10 | 9 |
| 15 | 19.7 |
| 20 | 21.3 |
| 25 | 22.3 |
| 30 | 13.3 |
| 35 | 6.7 |
| 40 | 7.3 |
| None | 0.3 |
A yes here is the ladder’s yes rule, the top two answers, so these shares aren’t calibrated.


How Surveti compares
| Capability | Surveti | SurveyMonkey | Qualtrics | Typeform | Alchemer |
|---|---|---|---|---|---|
| A built-in Gabor-Granger question | yesA question type | no1Not in the question list | no6A separate study project | no9No such field type | no13Not in the question list |
| Inside any survey, more than once | yesAnywhere, any number | partial2Built by hand with skip logic | no6One pricing block per survey | unclear9Not documented | partial11An example survey; more than once not covered |
| Your own list of prices | yesPrices you type or generate | partial2One question per price | no6Worked out from min, max and tolerance | unclear | partial11Min, max and step |
| Adaptive up and down | yesOr high → low, or random | partial2Ascending, by skip logic | yes6Random start, halving steps | unclear9Logic jumps exist; no ladder documented | yes11Random up or down |
| A 5-point likelihood answer | yesOr Yes / No; calibration editable | partial2Whatever you build | no6Yes / no | unclear | partial11Two or five buttons |
| Demand and revenue curves built in | yesResults, dashboards, decks | partial2Worked out yourself | paid6, 7In the study report | no10Template is Van Westendorp | partial11Fall-off of buyers; revenue not mentioned |
| Every asked price in the data | yesA rating per price | partial2A column per question you built | no6Last agreed price only | unclear | unclear11Not covered |
| Plan | paidSolo & up | unclear | paid7Research Core 5 licence | no9No ladder on any plan | unclear11Not stated |
Partial means partly built in or possible only with a documented workaround; paid means built in on paid tiers or licences only; unclear means the vendor’s docs don’t settle it. QuestionPro (Research Edition) and SurveySparrow also have a built-in Gabor-Granger method, with demand and revenue curves. Google Forms has no pricing question.
Put a ladder anywhere in any survey, next to any other question, and use more than one if you’re pricing more than one thing.
Respondents see the prices on your list and nothing else, and the server replays every path against the ladder rule.
A 5-point likelihood scale with “Probably would buy” counted as a partial yes. Use the defaults, set your own, or turn it off.
A rating for every price asked, plus the highest price accepted, in CSV, Excel and SPSS (SPSS on Professional+).
The same curves on dashboards and in PowerPoint and PDF decks, with filters carried through, and weights on Research Team: each respondent’s own weight counts, and a rake scheme doesn’t apply to price tiles. The deck’s Excel sheet holds the figures behind the curves.
The price ladder, the price meter and the Pricing Study template are all on Solo and up.
When to use it
“Think about a year of Trailhead Plus, the hiking-route app.” then “Would you buy it at $25?” · Definitely would buy … Definitely would not buy
Accessibility
Each price is a group of ordinary radio buttons, named by the question with its price, so screen readers and keyboards handle them as they would any form.
After Next or Back, focus moves to the new price’s question, so a screen reader reads it straight away.
“Price 2 of up to 3” sits in a status line that screen readers announce. You can turn it off.
Each choice is a full-width row, at least 44px tall by default.
Use it in
Template
A product description, a price meter, a price ladder, purchase frequency and an open question. Replace the description and set your prices.
Solution
Price a launch for a client and hand over the demand and revenue chart in the deck.
Solution
Test a new plan or a price rise with your own users before you ship it.
Solution
Choose between three or four prices for a new product with a short survey.
A way to price a product by asking people whether they would buy it at a series of prices. Put together, the answers give a demand curve. Multiply demand by price and you get revenue, and the price where revenue peaks.
With the adaptive order, 3 for 7 prices and 4 for up to 15: it starts in the middle and halves the range each time. High → low stops at the first yes, so it varies (4.4 on average in the example). Random order asks every price.
People say they’ll buy more often than they do. With calibration on, the default, “Definitely would buy” counts as a 75% chance of buying, “Probably would buy” as 25%, and the rest as none. Those numbers are a starting point: change them, or turn calibration off to count the top two answers as a yes.
One column for the highest price the person accepted, then one per price with the rating they gave, empty where a price wasn’t asked. The highest-price column is empty both when someone said no to every price and when they didn’t answer; the rating columns tell you which.
Yes, by filtering Results on another answer, such as how often people buy: the curves and the best price on your ladder are worked out for that group. Crosstabs, tab books and significance tests don’t include price ladders yet.
You can, and anyone on the question at that moment gets the new ladder, and answers it again if their path no longer fits. But Results and exports read every answer against the ladder as it is now, so changing prices or order changes how earlier answers count, and changing the currency relabels them. Settle them before you launch.
Yes, Pricing Study, on Solo+. It asks a price meter first, then a price ladder, then purchase frequency and an open question. Replace the product description and set your own prices before you launch.
Van Westendorp: people name four prices and you get an acceptable range. Solo+.
Trade price against features and brands. Research Team.
Find which features matter most, before you price them. Research Team.
One likelihood question at a single price. Free.