LiveSolo+
Any currency, whole units or cents
Pick USD, EUR, GBP, CAD, AUD or JPY, or type any three-letter code. Choose whole amounts or cents.
Price meter · Advanced
Ask the four Van Westendorp price questions in any survey. Surveti draws the four curves and works out the acceptable price range, the optimal price and the indifference price as answers come in. Add a purchase-likelihood follow-up for trial and revenue curves.
Live demo
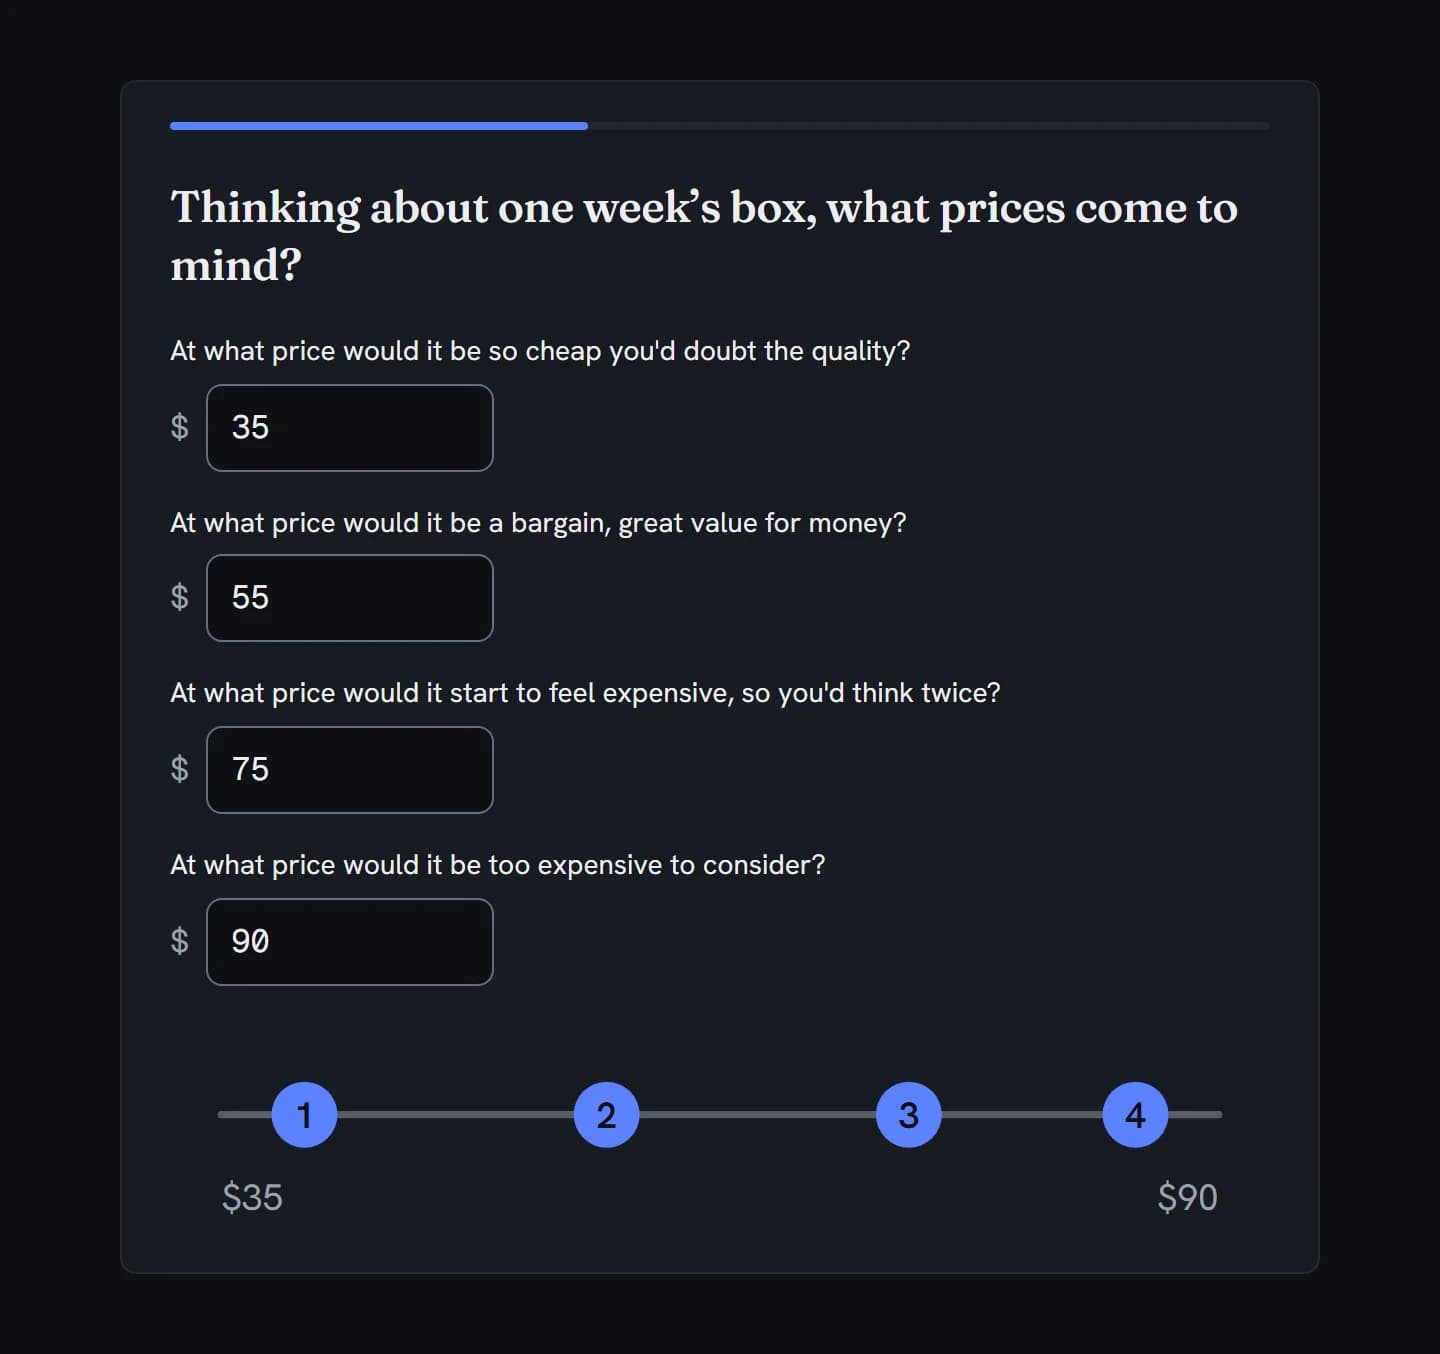
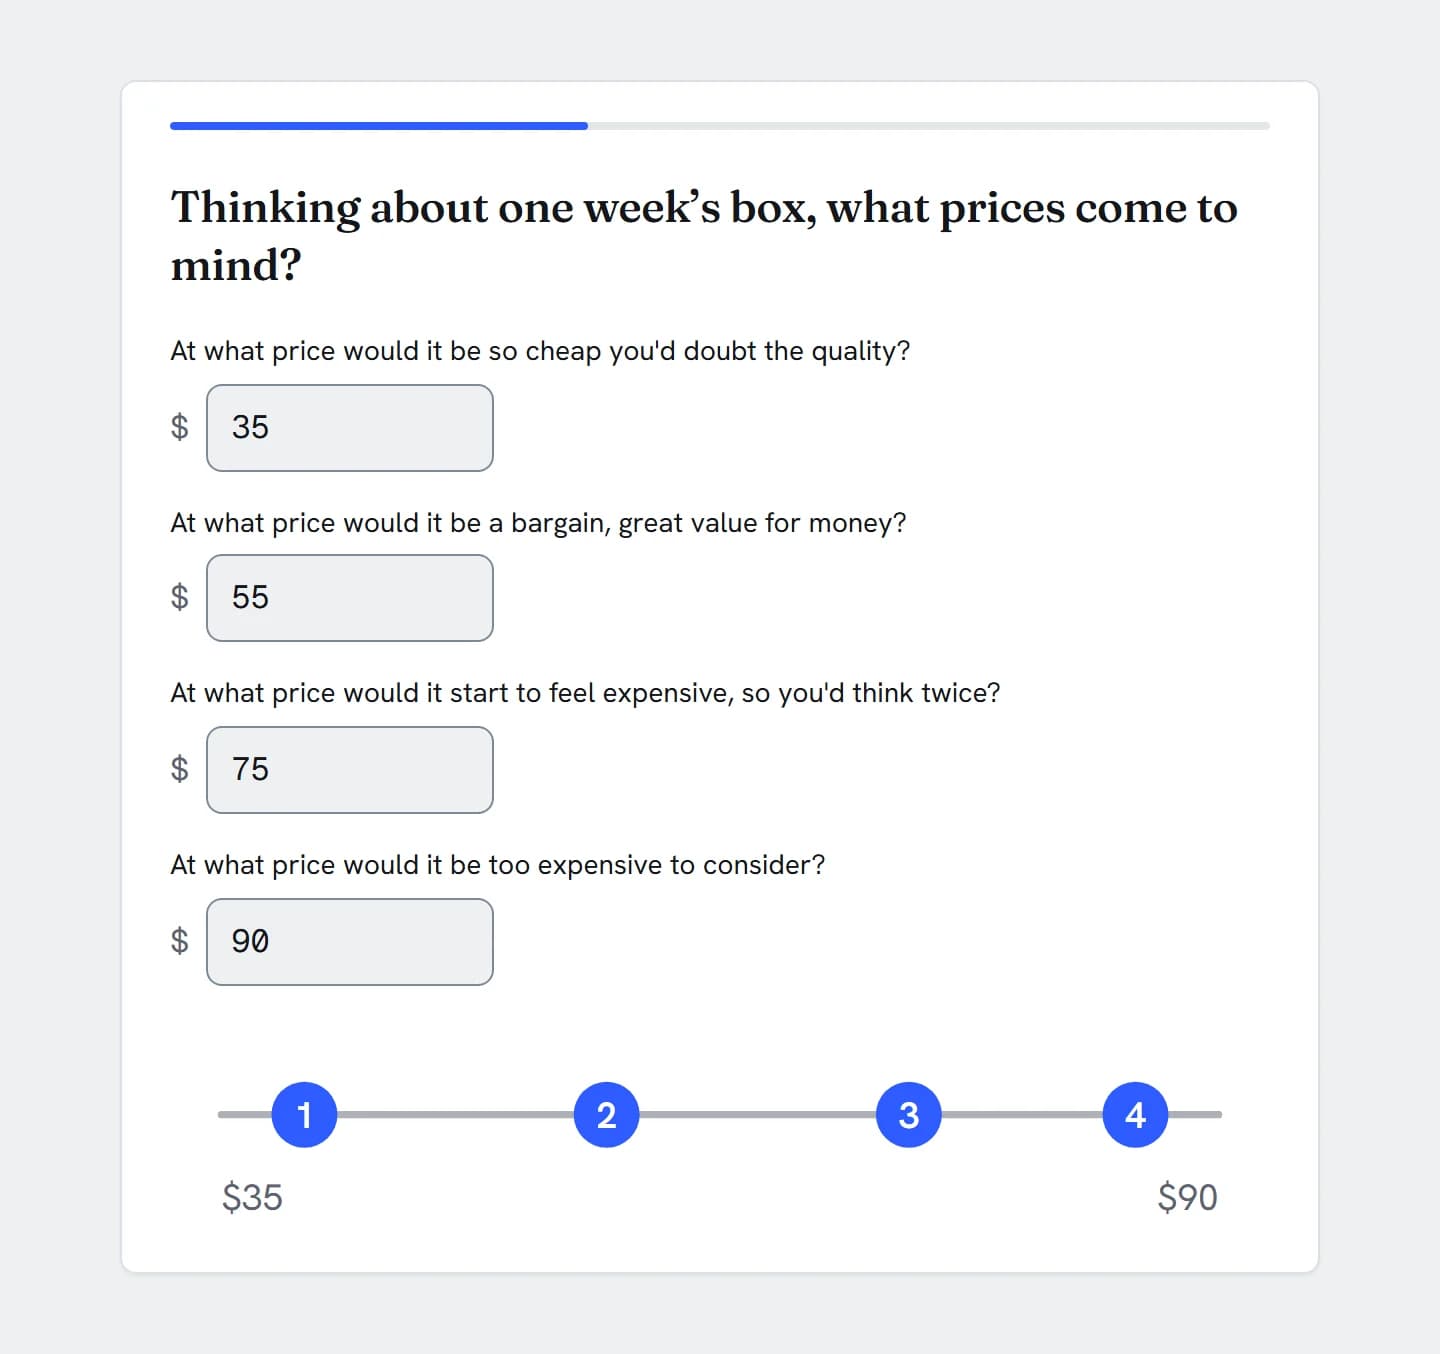
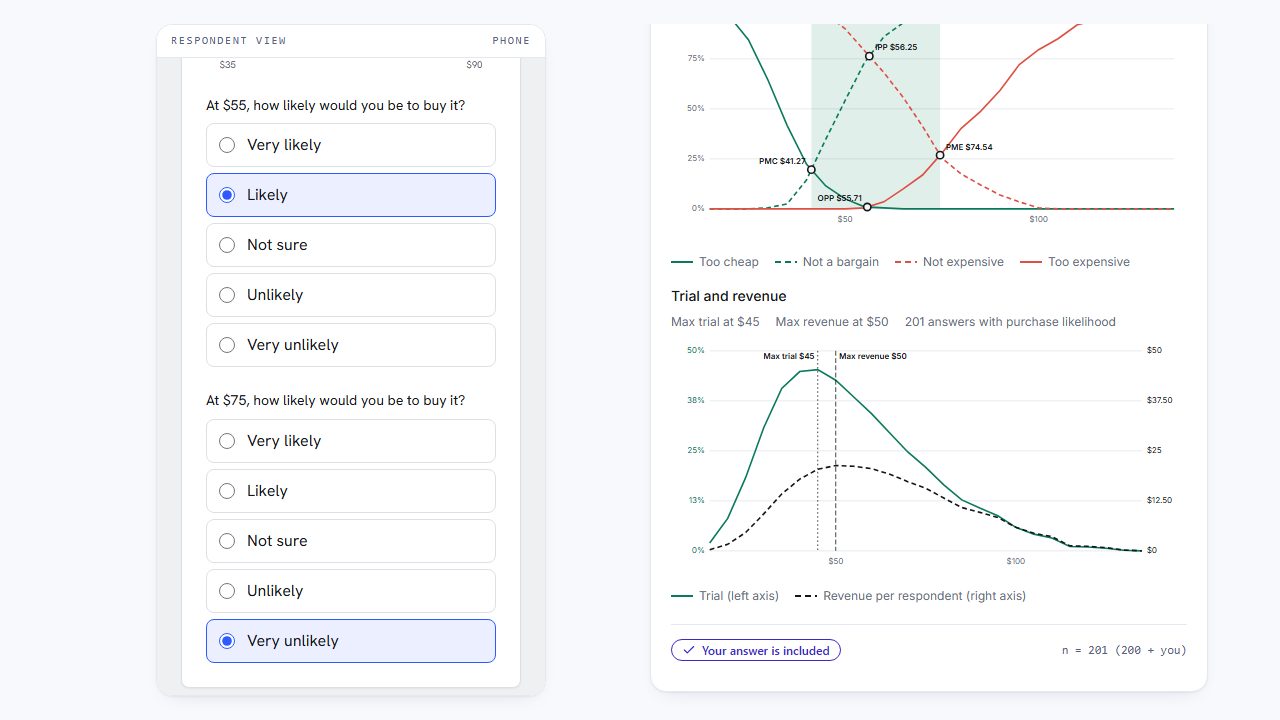
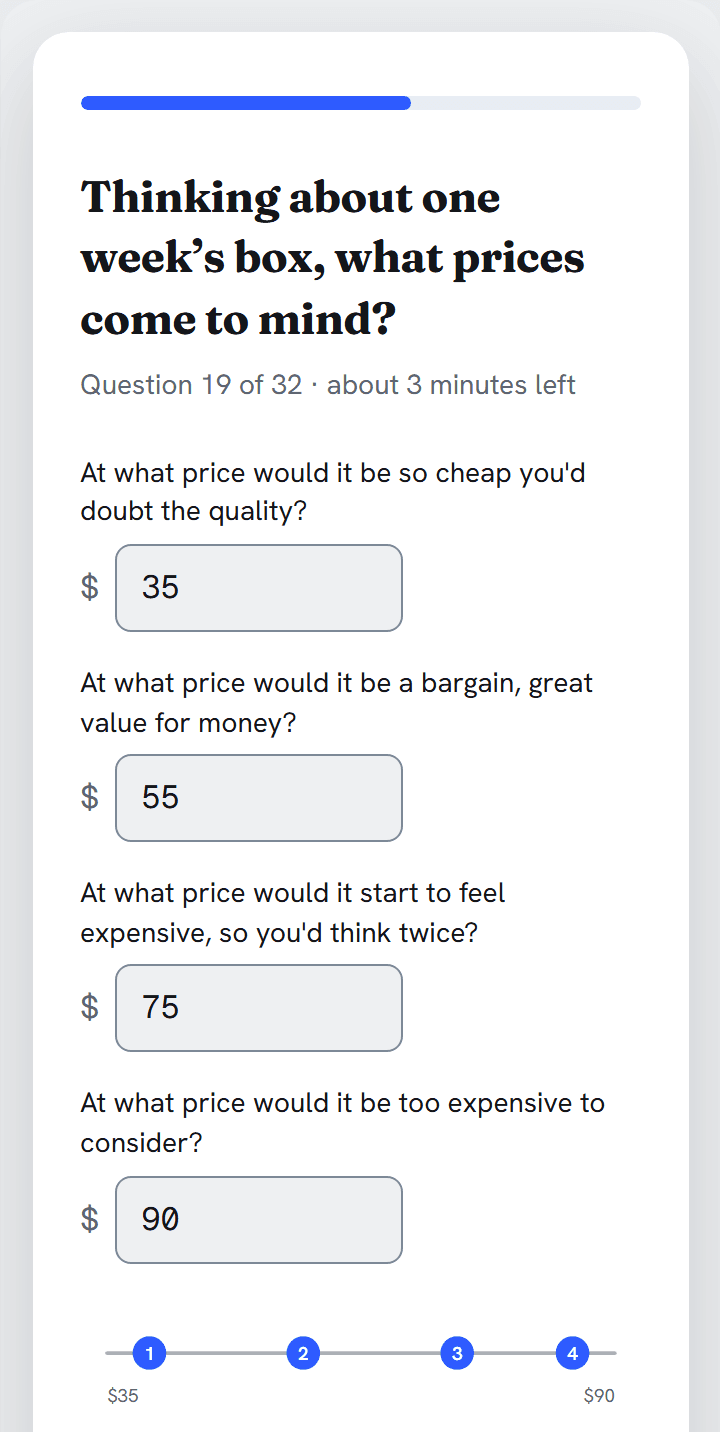
This is the question your respondents get. Type a price in each box, and the chart beside it recalculates with your answer counted.
Thinking about one week’s box, what prices come to mind?
In action
Every feature
Your wording and currency, a price-order rule you choose, a number line for respondents, and results that go wherever you report.
Pick USD, EUR, GBP, CAD, AUD or JPY, or type any three-letter code. Choose whole amounts or cents.
Set Min and Max. A price outside them gets a message and can’t be submitted.
Start from the standard wording or write your own. Each prompt keeps its data name.
The four are always asked lowest first.
Require ascending, Flag only, or Off. Flag only lets people through and leaves the answer out of the curves.
Show the four prices someone typed on a line, numbered 1 to 4, with a price outside your range, or out of order under Require ascending or Flag only, in red.
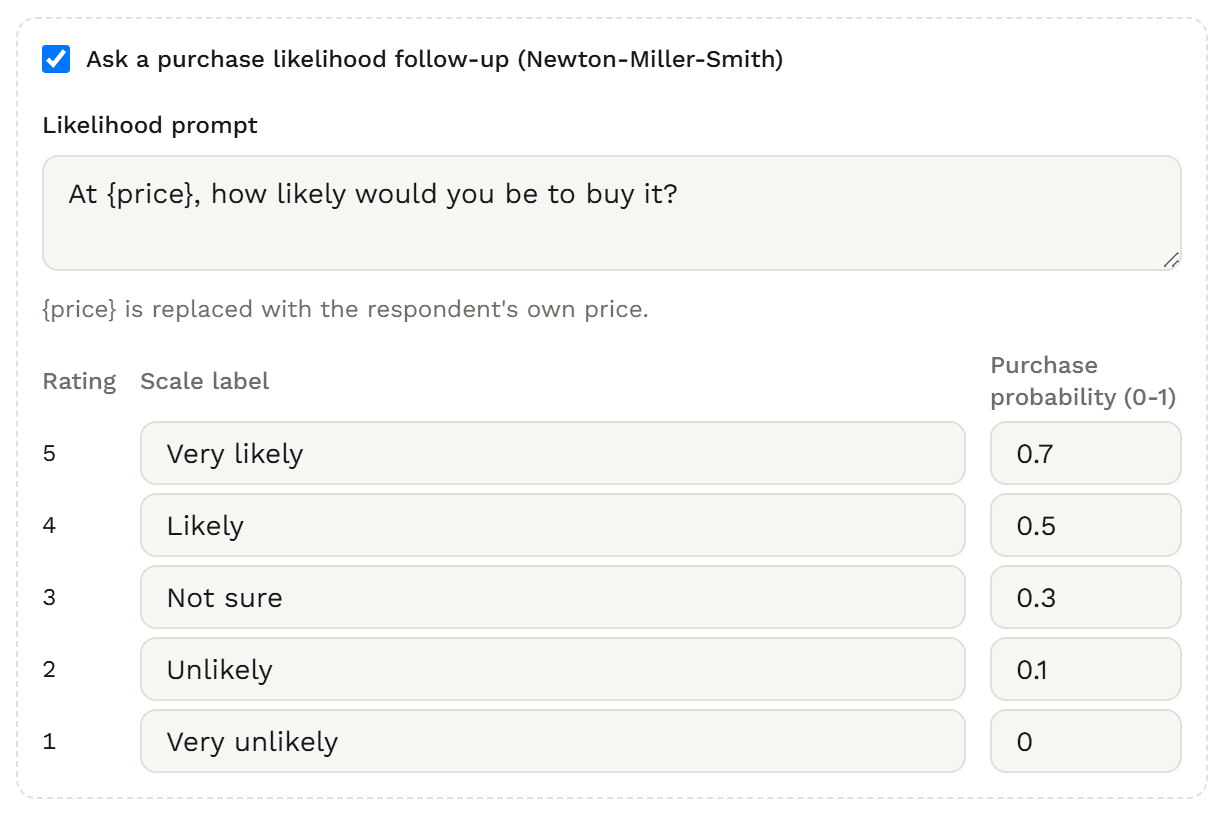
Ask how likely people are to buy at their own bargain and expensive prices, with five labels and the purchase probability behind each.
Between the two prices, the purchase probability runs in a straight line; it holds out to the too-cheap and too-expensive prices and is zero beyond.
An optional question can be left blank, but never half-filled: it’s four prices or none.
The prompts, the likelihood question and its labels translate; respondent messages come in six languages.
Server messages and chart labels are in English.
Start from a template with a product description, this question, a price ladder and two short follow-up questions.
Type 25, 1,299.00 or 19,99, one price per box; the currency symbol sits beside each. What you type stays as typed.
A price outside your range or with cents on a whole-amount question gets a short message under its box, and so does one no higher than the one above under Require ascending.
The same check runs in the browser and on the server, so Next and the saved answer always agree.
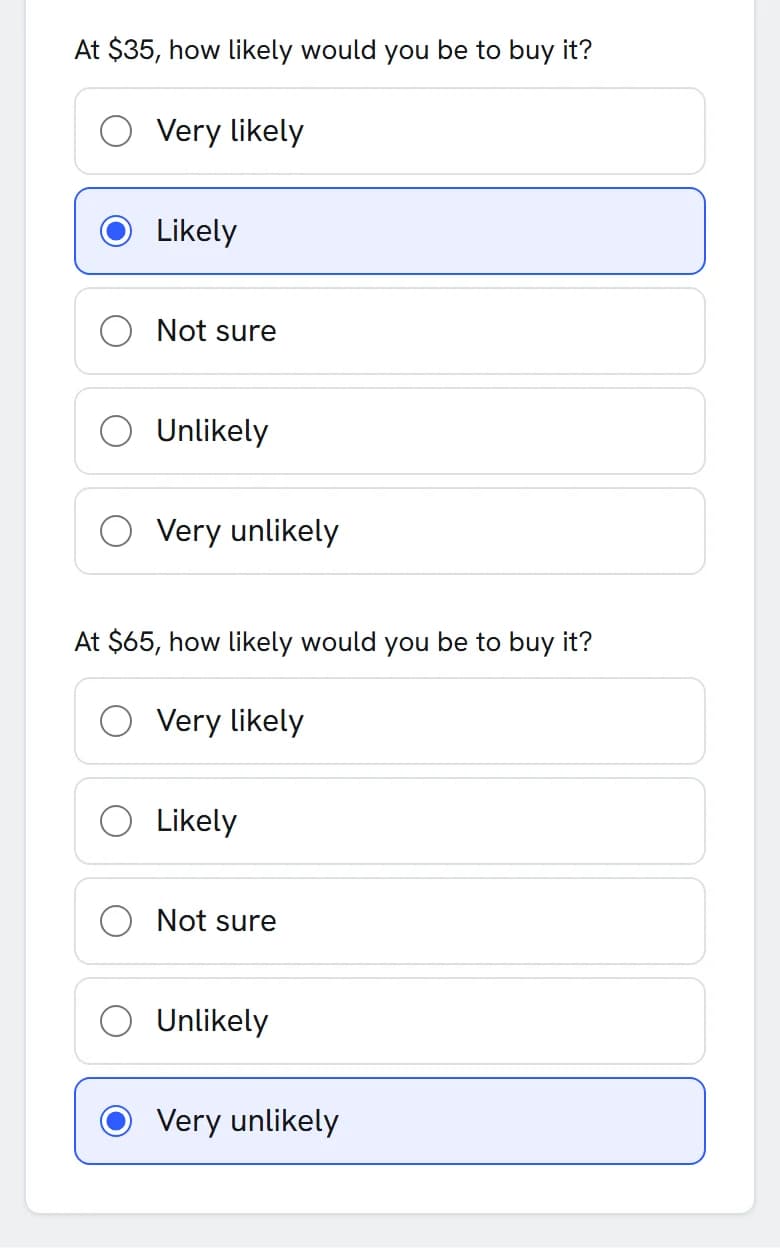
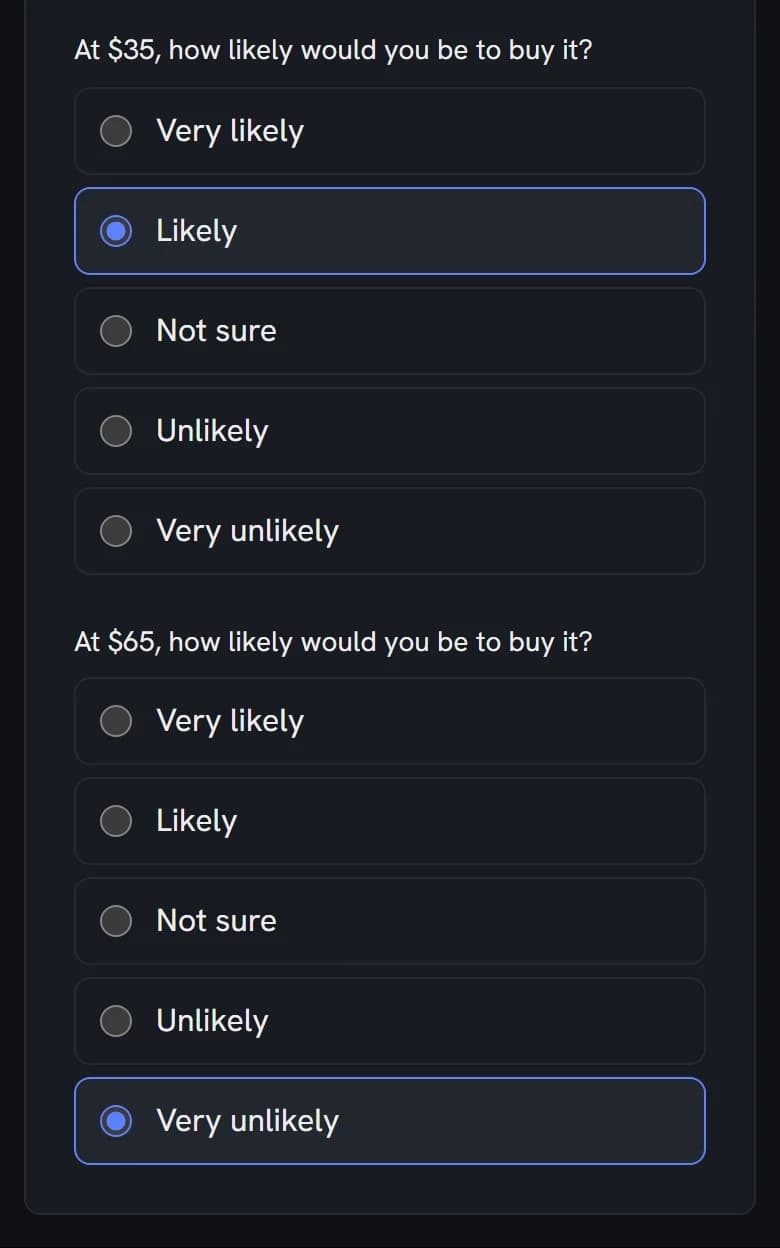
The likelihood question names the respondent’s own price, such as “At $55, how likely would you be to buy it?”
On a phone, each box opens the number keypad with a decimal point.
Boxes, number line and choices follow the survey’s theme and dark mode.
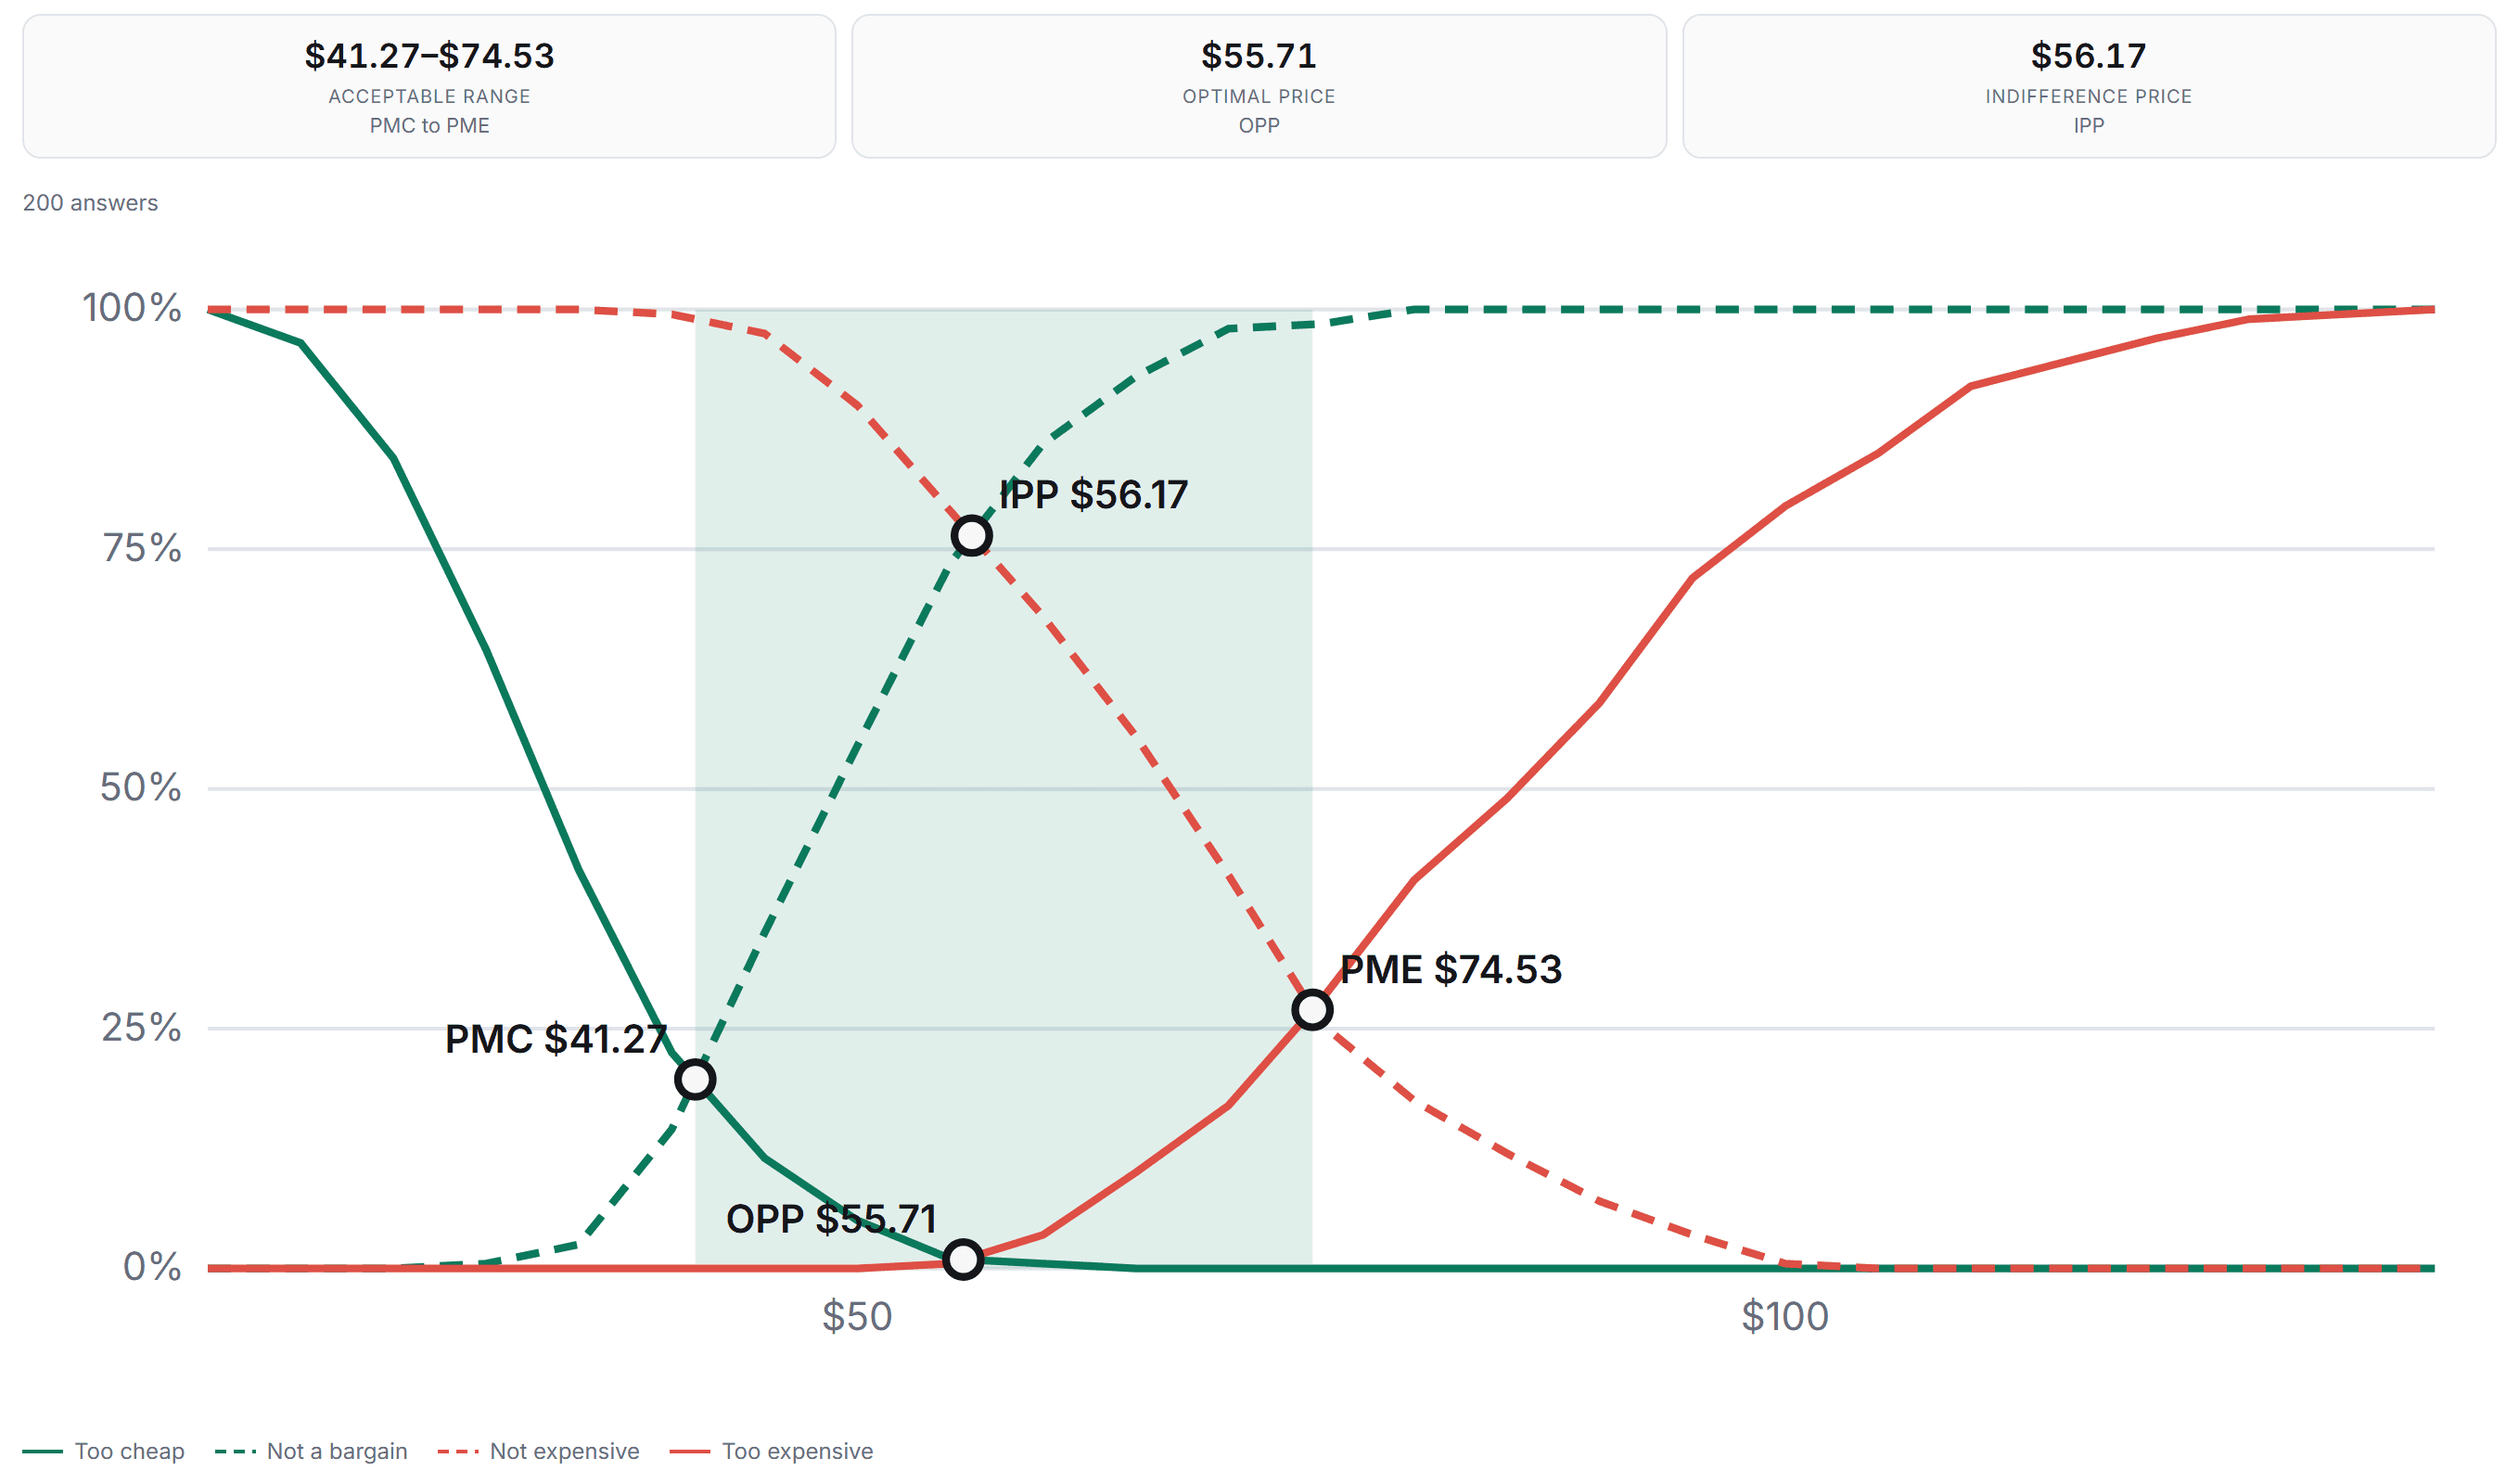
Too cheap, not a bargain, not expensive and too expensive, with the acceptable range (PMC to PME), the optimal price (OPP) and the indifference price (IPP).
On Results, the range is shaded and the four points are marked on the curves.
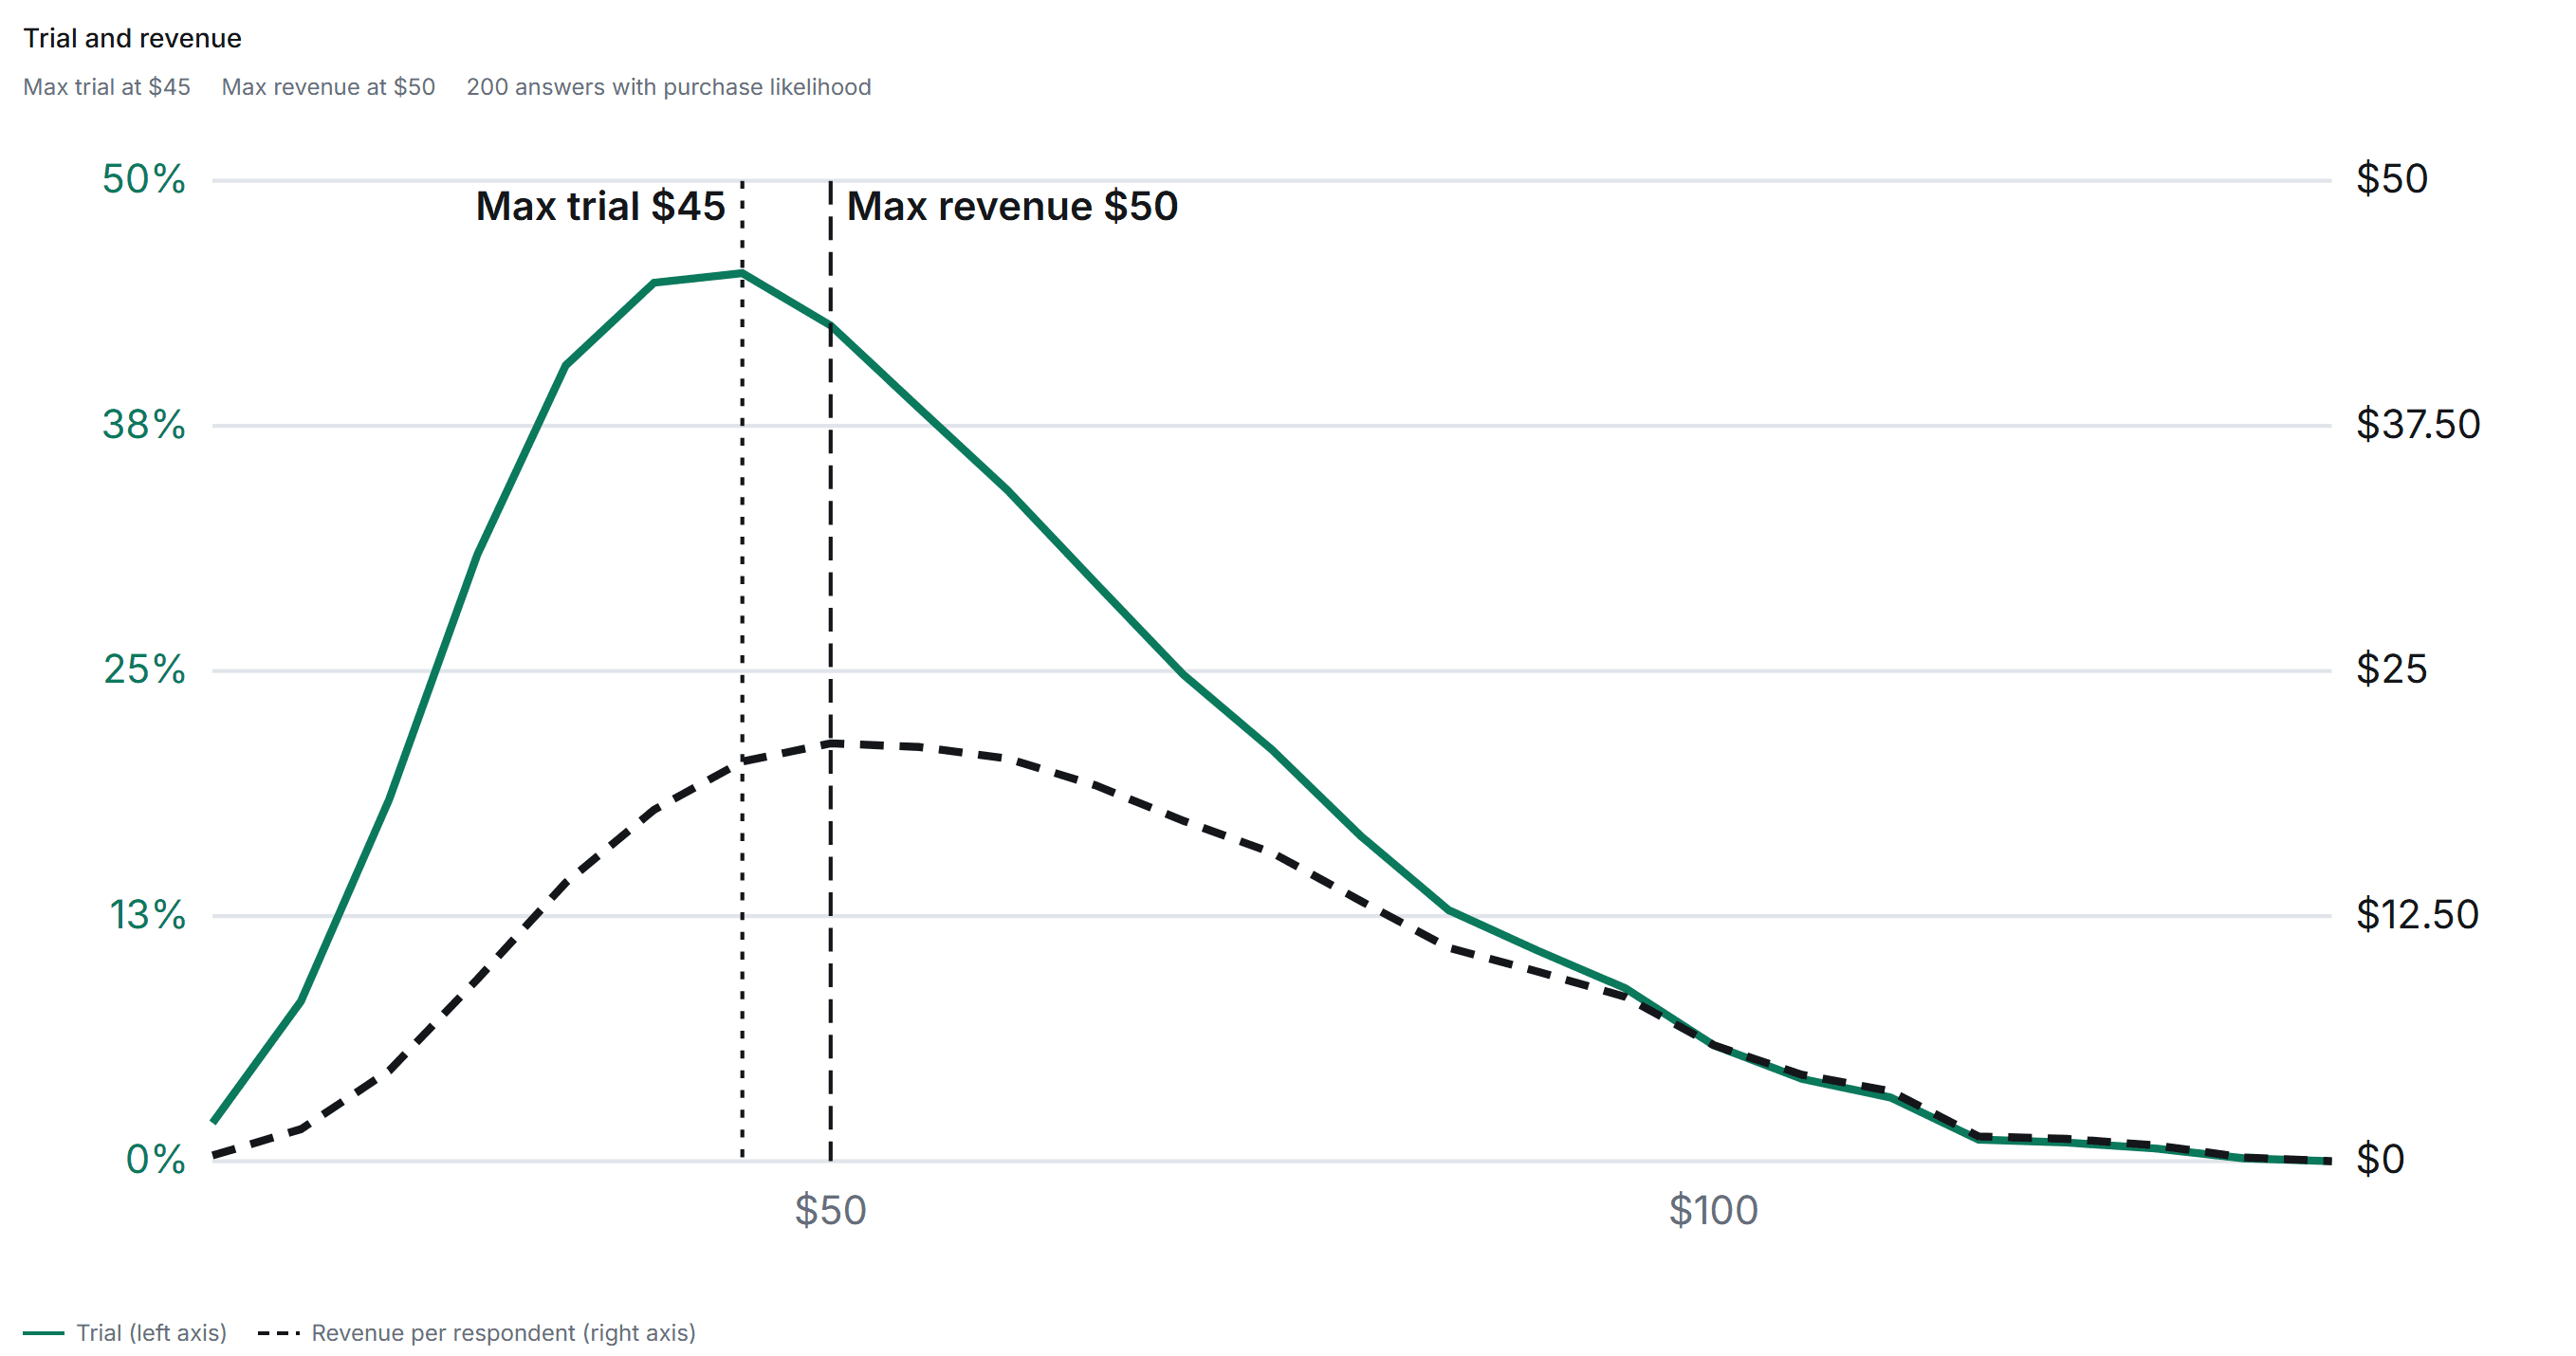
With the follow-up on, see trial, and revenue per respondent, across the prices people gave, with the maximum of each marked.
Filter Results, a dashboard or a slide to a group, and every curve and point recomputes.
One group at a time; price meters aren’t in crosstabs yet.
An auto dashboard adds a price tile, plus a trial tile when the follow-up is on; add your own with the tile editor.
On the dashboard, Create shareable report builds a deck with the price slides. It exports to PowerPoint, PDF and Excel, and you can share it to the client portal.
Weights carry through to the curves, the points and trial and revenue.
Each respondent’s own weight; a rake scheme doesn’t apply to price tiles.
Four numeric columns, named after the question and the price, such as Q1_too_cheap.
Q1_order_ok is 1 when the prices rise and 0 when they don’t.
Prices are scale variables; likelihoods are ordinal with your labels; the order flag is labelled.
Not part of the price meter yet: a Don’t know option, crosstabs and tab books, branching or piping on a price, Excel or Qualtrics import, and asking the prices from highest to lowest.
Choosing
Both are pricing questions. The price meter asks people for their own prices. A price ladder asks whether they’d buy at prices you choose.
Not sure? The Pricing Study template asks both: the price meter first for the range, then a price ladder with prices you can edit. Price is one feature among several, such as size and brand? Use conjoint (Research Team).
Build it
Add a description just before the question, so everyone prices the same thing: what it is, who it’s for and what’s included.
In the builder, choose Price Sensitivity (Van Westendorp) from the Advanced group. It comes with the four standard prompts, in US dollars, whole units, from 0 to 5,000.
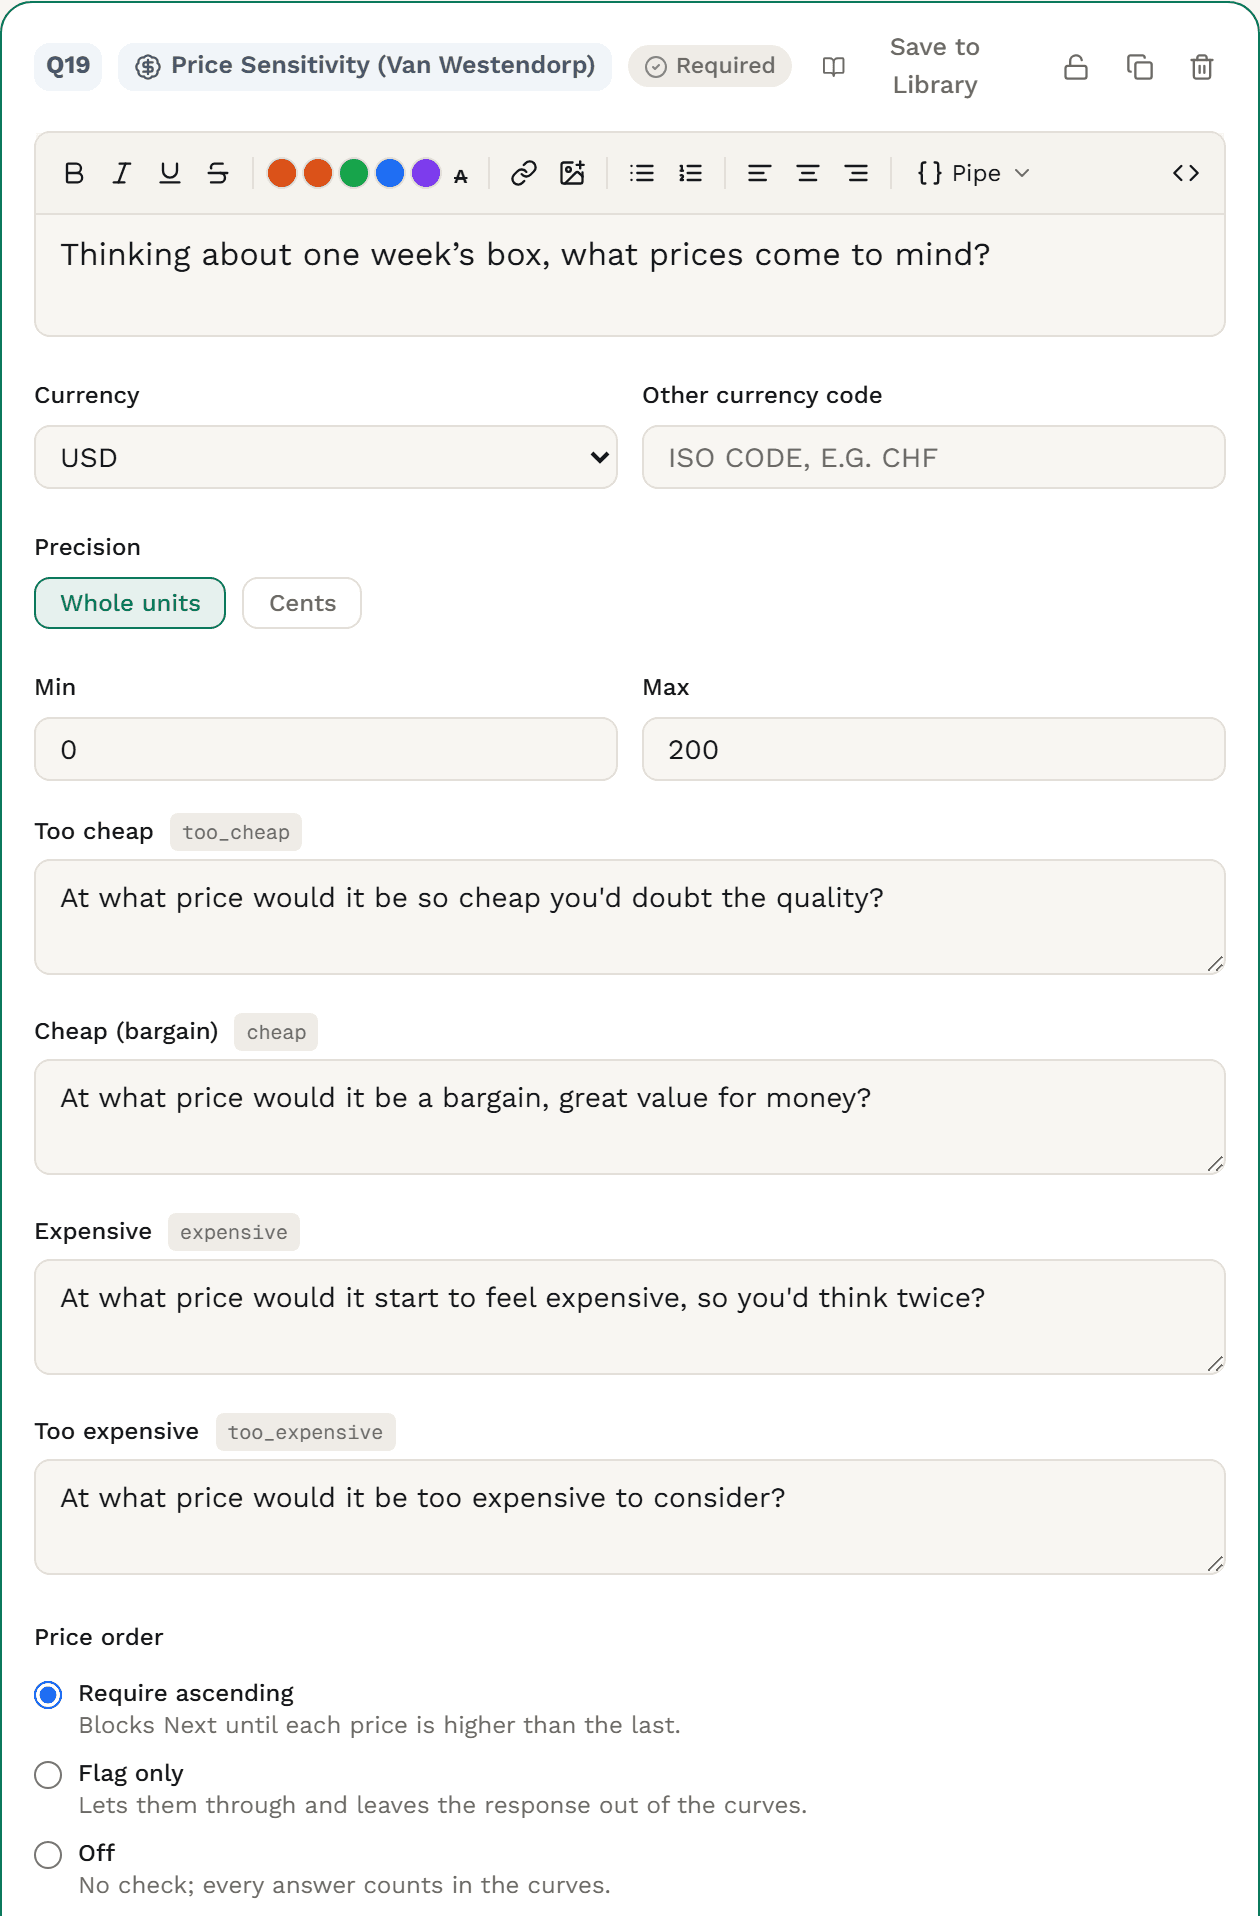
Pick a Currency (or type any three-letter code in Other currency code), choose Whole units or Cents, and set Min and Max to bound every price.
Keep the standard wording or write your own. Each prompt keeps its data name, such as too_cheap, whatever it says.
Require ascending stops Next until each price is higher than the last. Flag only lets people through and leaves the answer out of the curves. Off counts every answer.
Tick Ask a purchase likelihood follow-up (Newton-Miller-Smith), keep or edit the five labels, and set the purchase probability for each. Then preview on a phone.
The data you get
Each price lands in its own numeric column. A fifth column says whether the four prices were in order, and the likelihood answers get columns of their own.
| respondent_id | Q1_too_cheap | Q1_cheap | Q1_expensive | Q1_too_expensive | Q1_order_ok | Q1_likely_cheap | Q1_likely_expensive |
|---|---|---|---|---|---|---|---|
| 47762a85-0001-4000-8000-000000000001 | 35 | 55 | 75 | 90 | 1 | 4 | 1 |
| 47762a85-0002-4000-8000-000000000002 | 30 | 35 | 65 | 95 | 1 | 4 | 1 |
| 47762a85-0003-4000-8000-000000000003 | 30 | 35 | 55 | 70 | 1 | 5 | 1 |
| 47762a85-0004-4000-8000-000000000004 | 20 | 40 | 65 | 75 | 1 | 4 | 4 |
| 47762a85-0005-4000-8000-000000000005 | 45 | 60 | 70 | 110 | 1 | 4 | 3 |
| 47762a85-0006-4000-8000-000000000006 | 20 | 55 | 70 | 125 | 1 | 4 | 3 |
| 47762a85-0007-4000-8000-000000000007 | 25 | 50 | 90 | 95 | 1 | 4 | 3 |
| 47762a85-0008-4000-8000-000000000008 | 30 | 50 | 70 | 90 | 1 | 4 | 4 |
Trimmed to the question’s columns. Prices are in US dollars: the file holds the numbers, not the currency. Every export also carries the respondent columns (status, timing, weight and more).
Named after the question and the price, such as Q1_too_cheap and Q1_too_expensive. Rewording a prompt never renames them.
Q1_order_ok is 1 when the four prices rise, 0 when they don’t, so you can see who a Flag-only question left out of the curves.
With the follow-up on, Q1_likely_cheap and Q1_likely_expensive hold 1 to 5, with your scale labels attached.
Excel gets number cells, ready to sort, average or chart.
Weighted exports fill the weight column with each person’s weight. Weighting is on Research Team.
Charts & analysis
Every price meter is charted for you. Filter to a segment and the curves recompute; put them on a dashboard or in a client deck.
Pantry Box: the price people find acceptableResults · price meter card · 200 answers
Trial and revenueWith the purchase-likelihood follow-up · 200 answers
Filter Results to a group, such as households with children, and the curves, range and optimal price recompute for that group.
Under Flag only, answers whose prices don’t rise are left out of the curves, and the card says how many.
On dashboards, in report decks and in the client portal, a chart under the survey’s minimum base, 30 by default, still shows, with a note to read it with care.
Weights carry through to the curves, the price points and trial and revenue, in Results, on dashboards and in decks. Each respondent’s own weight counts; a rake scheme doesn’t apply to price tiles.
How Surveti compares
| Capability | Surveti | SurveyMonkey | Qualtrics | Typeform | Alchemer |
|---|---|---|---|---|---|
| Built-in Van Westendorp | paidA question type · Solo+ | paid1, 4LaunchPad solution, per study | paid9, 10Guided solution, Research Core 3 | no16, 17Template only; no analysis | unclear18Not in the question types guide |
| Works as a question inside any survey | yesBeside any other question | partial1, 3Its own study; add custom questions | partial12Program your own to embed | no17 | unclear |
| Edit the four price prompts | yesAll four, translatable | no1“Can’t be changed” | unclear9Questions not listed | partial16A template, not a type | unclear |
| Price-order check | yesRequire, flag or off | yes2Validation toggle, on by default | unclear | no | unclear |
| Four curves with PMC, PME, OPP and IPP | yesIn Results, decks, dashboards | yes1, 2Price Sensitivity Meter | partial9OPP and range named | no16 | unclear |
| Trial and revenue from a likelihood follow-up | yesYour calibration | unclear5Purchase intent as an extra question only | unclear9Not stated | no | unclear |
| Filter the meter to a segment | yesResults, tiles, slides | yes1, 2Key findings filters | unclear | no | unclear |
| The meter on a dashboard | yesPrice and trial tiles | unclear | no13Report, not dashboard (community) | no | unclear |
| The meter in a PowerPoint or PDF deck | yesPowerPoint, PDF, Excel | unclear2Chart to CSV, XLSX, PNG | partial9PDF report | no | unclear |
| Raw prices to SPSS | paidScale variables · Professional+ | yes1, 4XLSX, SPSS, CSV | unclear9Not stated | no28CSV or XLSX only | unclear |
Partial means partly built in or possible only with a documented workaround; paid means built in on paid plans, licences or as a paid add-on; unclear means the vendor’s public docs don’t settle it. QuestionPro (Research Edition licence) and SurveySparrow also have a built-in Van Westendorp question, with a reversible question order; SurveySparrow also offers slider entry. Google Forms has no number-only question type.
Put the price meter in any survey, after your screener and before your profile questions. No separate project, no fixed flow.
Edit all four prompts and translate them with the rest of the survey. The data names stay fixed.
Require rising prices, accept prices out of order and leave them out of the curves, or count everything. The export flags each answer in every mode.
Respondents see the four prices they typed on a number line, numbered in the order asked, so a price out of place stands out.
The same curves on dashboards, in PowerPoint and PDF slides, and in the client portal; the Excel export holds the figures behind them.
Add the likelihood follow-up and set the purchase probability behind each answer, from Very likely to Very unlikely.
When to use it
“At what price would it be so cheap you’d doubt the quality?” · “…a bargain, great value for money?” · “…start to feel expensive, so you’d think twice?” · “…too expensive to consider?”
Accessibility
Each price box is a native text field with its prompt as its label, reachable with Tab.
A price out of range, or out of order under Require ascending, is marked invalid, and its message is attached to that box.
The likelihood follow-up is two radio groups, each named by its prompt, with arrow-key selection.
On Results, a table of each price and each curve’s share sits behind the chart for screen readers.
Use it in
Template
A product description, this price meter with the likelihood follow-up, then a price ladder, ready to edit.
Solution
Find the acceptable range for a new product, then see it for one group at a time with a Results filter.
Solution
Check a planned price, or a new tier, against what users would pay.
Example
“Thinking about one week’s box, what prices come to mind?” with the four standard prompts.
Four curves, built from the four prices each person gives, and four points where they cross: the point of marginal cheapness (PMC) and the point of marginal expensiveness (PME), which bound the acceptable range; the optimal price (OPP), where as many say too cheap as too expensive; and the indifference price (IPP), where as many say it’s a bargain as say it’s expensive.
You choose. Require ascending asks them to fix it before Next, and the server checks again. Flag only lets them through and leaves the answer out of the curves. Off counts every answer. In every mode, the export’s order flag shows which answers rose.
The chart appears from the first complete answer. On dashboards, in report decks and in the client portal, a chart below the survey’s minimum base, 30 by default, carries a note to read it with care. The example on this page uses 200 answers.
Yes. All four prompts are editable, and they translate with the survey, as do the likelihood prompt and labels. Respondents’ messages come in English, Spanish, French, German, Portuguese (Brazil) and Italian.
Turn on the purchase-likelihood follow-up and each respondent rates how likely they are to buy at their own bargain price and their own expensive price. Each rating becomes a purchase probability you set (by default 70%, 50%, 30%, 10% and 0% from Very likely to Very unlikely). Surveti draws a straight line between the two, keeps the bargain-price value down to the respondent’s too-cheap price and the expensive-price value up to their too-expensive price, and counts zero beyond. Trial at each price is the average; revenue is price times trial.
Yes. On the dashboard, Create shareable report builds a deck with a price slide for each price meter, plus a trial and revenue slide when the follow-up is on, and it exports to PowerPoint, PDF and Excel. The curves also go on dashboards and in the client portal.
The price meter is on Solo+, with every setting, the charts, dashboards, decks and CSV and Excel exports. SPSS export is on Professional+, and weighting on Research Team.