LiveFree
Any total
Type the total the points add up to: 100 points, 10 chips, 24 hours.
Constant sum · Ranking
Give people a fixed number of points, such as 100, and ask them to share it across a list. Because every point given to one item is a point taken from another, you see how much more one thing matters than the next. Set a total, and a running count tells respondents when they’ve hit it.

Live demo
This is the question your respondents get. Type points into the boxes, watch the total, and press Next. Once Next accepts your answer, the chart beside it counts it.
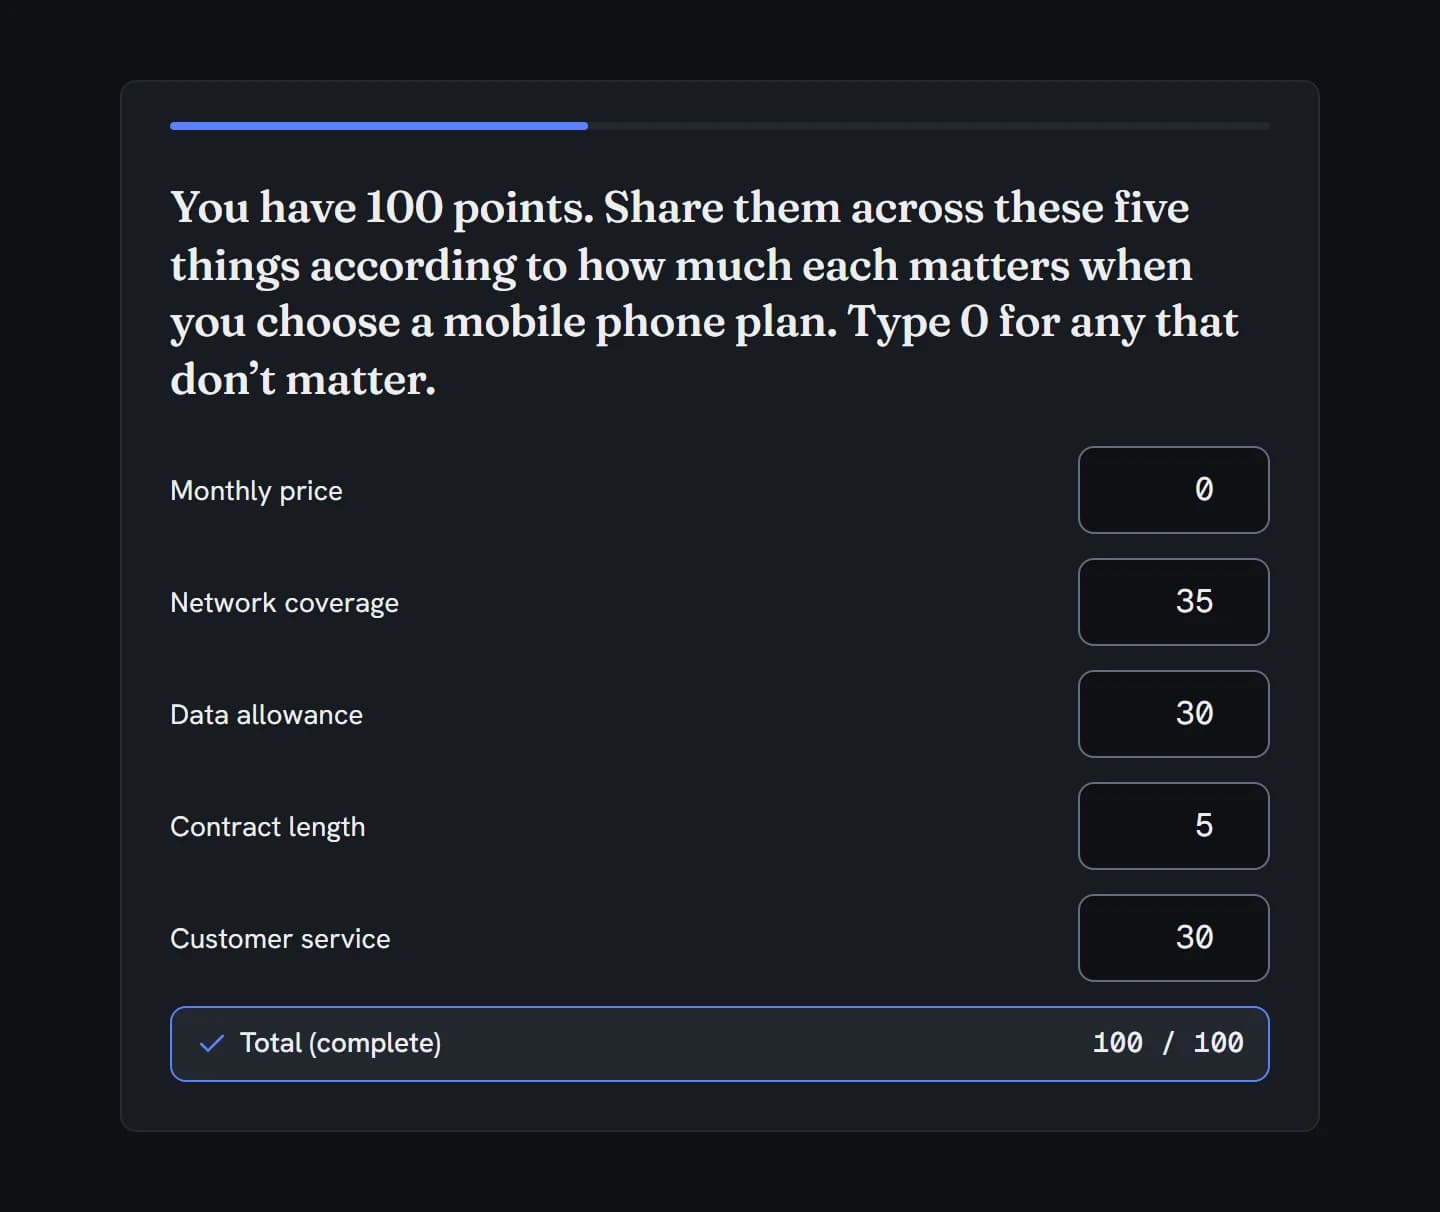
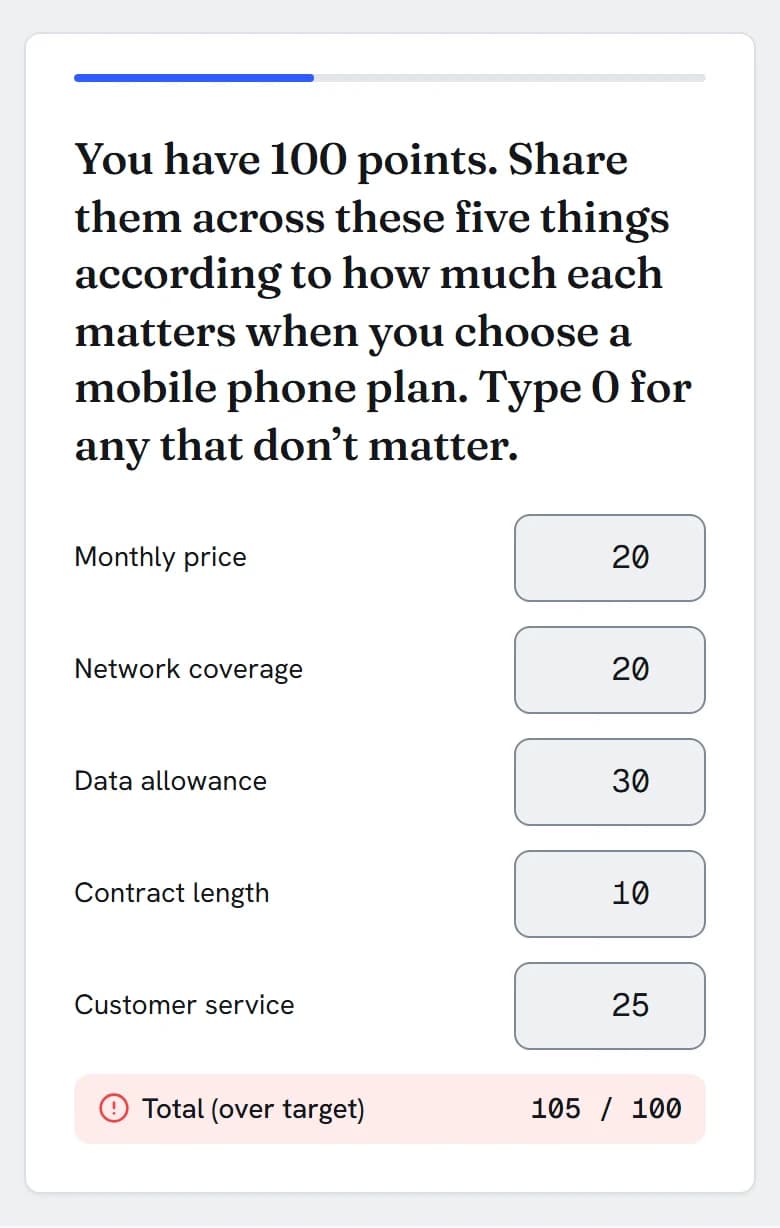
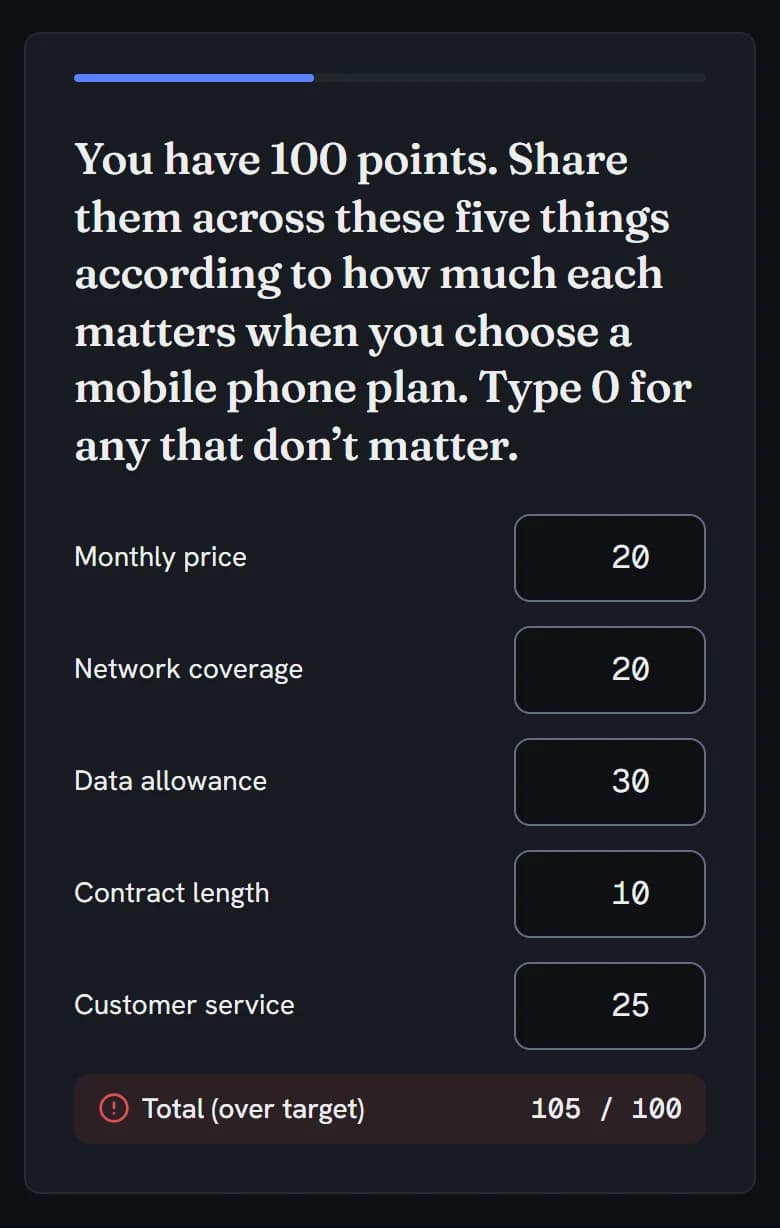
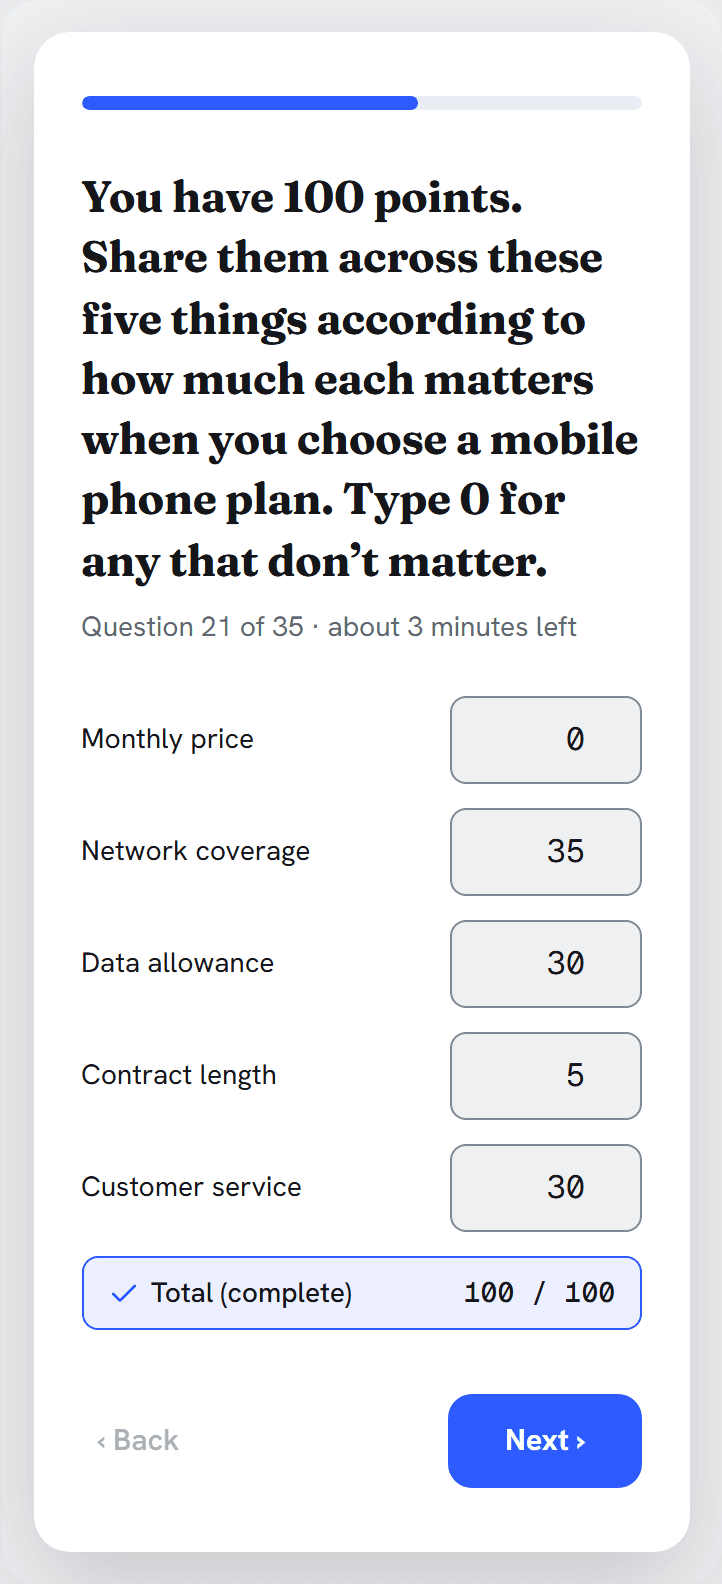
You have 100 points. Share them across these five things according to how much each matters when you choose a mobile phone plan. Type 0 for any that don’t matter.
Total0 / 100
In action
Every feature
Your total and your items, a running count for respondents, a server check on required answers, and one clean column per item.
Type the total the points add up to: 100 points, 10 chips, 24 hours.
List the items to share points across. Each gets its own column in your export, named after the question with a number for each item.
Randomise the order for each respondent, and fix the items that must stay in place.
Give an item its own display logic, so it appears only for the people it fits.
Required waits for the total exactly. Optional accepts a blank or any total. Soft required asks once first, then accepts the same.
Your items translate with the rest of the survey; the total and its messages come in six languages.
Server messages and the Results note are in English.
Product Feature Prioritization pairs MaxDiff and ranking with a 100-point constant sum.
The template needs Research Team for its MaxDiff.
The total under the boxes counts up, says “Total (complete)” at the target and “Total (over target)” past it.
Up to two decimal places, compared to the cent, so 33.33 + 33.33 + 33.34 reaches 100.
Negative numbers become 0.
Press Next with the points short or over, and the message names the target and the current total.
On a required question.
On a required question, Next waits until the points match the total, and the server checks again before saving.
Each item’s box is a number field, so phones bring up a number keyboard.
Boxes and the total follow the survey’s theme and dark mode.
Results shows where the points went as a share per item, as a bar, a pie or a table.
A box left blank counts as 0.
Your client sees the same chart on the portal’s Results page.
One column per item, such as Q1_1, labelled with the question and the item.
A box left blank is empty; there’s no total column.
Every item is a numeric scale variable, labelled, ready for means and models.
Not part of the constant sum yet: a minimum or maximum per item, a % or $ beside the box, a slider or bar format, a points-remaining counter, a Don’t know option, dashboards and report decks, crosstabs and tab books, filtering, branching or piping on the points, and the respondent’s total as its own column.
Choosing
All three make people trade items off against each other. They differ in what you get back.
Need each item rated on its own scale instead? Use a rating scale (Free), knowing that everything can then be “very important”.
Build it
In the builder, choose Constant Sum from the Ranking group, and write the question. Say what the points are and how many there are.
Target Sum starts at 100. Change it if your total is different, such as 10 chips or 24 hours. That is the number a required answer must add up to.
Replace the two starter categories under Categories with your own, one per line. Five to eight items work best.
In Randomization, shuffle or rotate the items for each respondent, and fix any that should stay put, such as “Something else”.
Required waits for the total exactly. Optional lets people skip, or move on with any total.
Preview on a phone, type some points, and watch the total count up until it reads “Total (complete)” at your number.

The data you get
Each item lands in a column of its own, named after the question with a number for each item, ready to average, sum or model.
| respondent_id | Q1_1 | Q1_2 | Q1_3 | Q1_4 | Q1_5 |
|---|---|---|---|---|---|
| 47762a85-0001-4000-8000-000000000001 | 0 | 35 | 30 | 5 | 30 |
| 47762a85-0002-4000-8000-000000000002 | 20 | 20 | 25 | 10 | 25 |
| 47762a85-0003-4000-8000-000000000003 | 20 | 20 | 25 | 20 | 15 |
| 47762a85-0004-4000-8000-000000000004 | 10 | 20 | 55 | 0 | 15 |
| 47762a85-0005-4000-8000-000000000005 | 55 | 25 | 0 | 10 | 10 |
| 47762a85-0006-4000-8000-000000000006 | 30 | 10 | 20 | 20 | 20 |
| 47762a85-0007-4000-8000-000000000007 | 10 | 25 | 30 | 15 | 20 |
| 47762a85-0008-4000-8000-000000000008 | 20 | 25 | 25 | 15 | 15 |
Trimmed to the question’s columns. A box someone left blank is empty in the file, not 0, and the file has no column for each respondent’s total: add the item columns if you need it. Every export also carries the respondent columns (status, language, timing and more).
Named after the question, with a number for each item, such as Q1_1 to Q1_5. Rewording an item never renames its column.
The points each person gave, up to two decimal places.
An item someone left empty stays empty in the file, so you can tell it from a typed 0. Recode blanks to 0 when every answer reached the total.
Every item column is a numeric scale variable, labelled with the question, then the item. SPSS export is on Professional+.
Charts & analysis
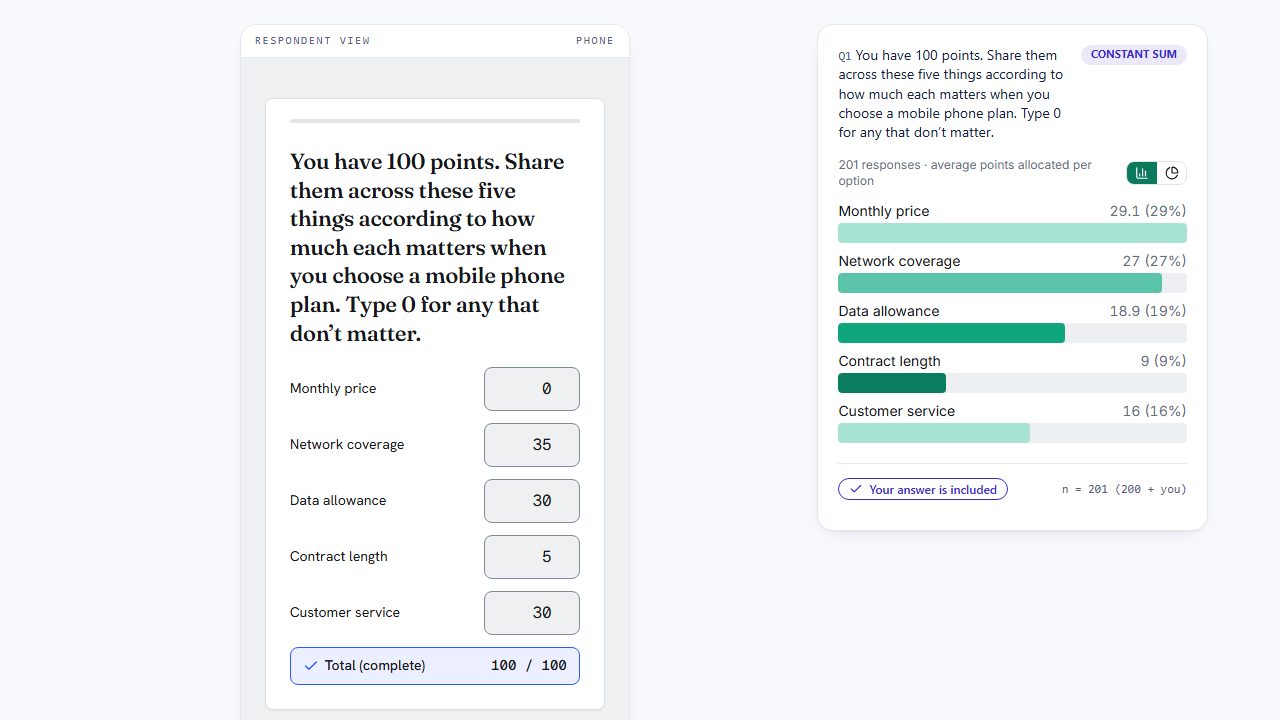
Every constant sum is charted in Results as you collect: a bar per item, with each item’s share. Switch it to a pie or a table in Results; in the portal, your client sees the chart as bars or a pie.
Choosing a mobile plan: where the points wentResults · constant sum card · 200 responses
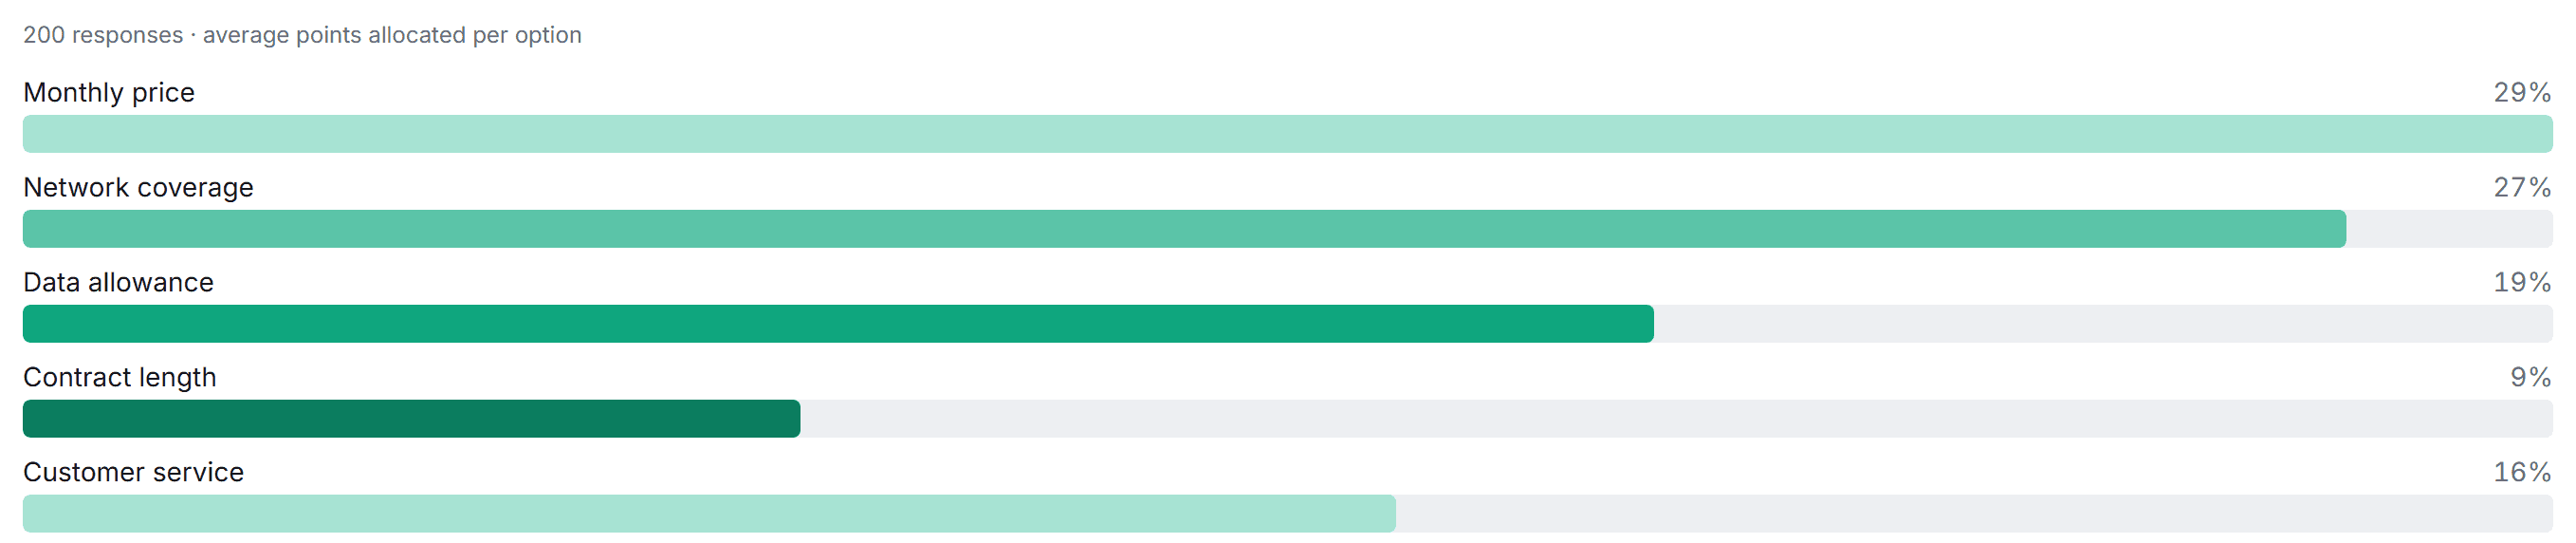
Results shows each item’s share, its average as a share of all the items’ averages; switch the value to # to see the average points instead. Each average counts a box left blank as 0.
The points add up to one whole, so a pie reads naturally here. Pick the view per question in Results.
In the client portal, under the survey’s minimum base, the chart still shows, with a note to read it with care.
Export the item columns to SPSS as scale variables, or to CSV and Excel on every plan, for means by group, tests or modelling.
How Surveti compares
| Capability | Surveti | SurveyMonkey | Qualtrics | Typeform | Alchemer |
|---|---|---|---|---|---|
| A constant sum question type | yesA question type | no1Fixed-sum textboxes instead | yes8Text boxes, bars, sliders | no14 | yes17, 18Continuous Sum |
| On the free or entry plan | yesFree | paid3Multiple Textboxes is paid | paid10Not on the free account | no14 | yes18Every licence; no free plan |
| Must add up to the total | yesClient and server, on required answers | partial2, 3Checked on Next only | yes8 | no14 | yes17“Must equal max” |
| Running total shown as they type | yesComplete / over target, in words | no2No running total | partial8Text boxes, vertical only | no | partial17, 19Implied by the accessibility guide |
| Running total announced to screen readers | yesA live status | unclear | unclear9 | no | no19“Some browsers do not update the Total” |
| Decimal entries | yesTwo places, matched to the cent | no2, 3Whole numbers only | partial8Bars and sliders | no | unclear17 |
| Minimum / maximum per item | no | unclear2, 3 | yes8Range requirement | no | yes17“Allow values between” |
| Unit symbol or format (%, $, hrs) | no | no2% not accepted | yes8Up to 4 characters | no | partial17Percent / Currency formats |
| Slider or bar format | no | no1 | yes8 | no | unclear17 |
| Per-item averages in results | yesAverage points per item | partial3Average per textbox | yes8, 11Statistics table | no | yes17Average, min, max, SD, sum |
| One export column per item | yes | unclear2, 3 | yes8 | no | yes17 |
| Respondent’s total in the export | no | unclear | partial8Embedded-data workaround | no | no17Not in reports or exports |
| In crosstabs | noNot yet | no4Not a crosstab type | unclear12 | no | unclear21 |
| SPSS export | paidScale variables · Professional+ | partial6Paid; type not named | unclear10 | no16CSV or XLSX only | unclear20Full Access; type not named |
Partial means partly built in or possible only with a documented workaround; paid means built in on paid plans or licences; unclear means the vendor’s public docs don’t settle it. SurveyMonkey has no constant sum type; its cells describe Multiple Textboxes with “Require a Fixed Sum”. QuestionPro (Essentials and up) and SurveySparrow also offer constant sum, with slider variations. Google Forms has none.
The running total sits under the boxes as people type, and says “Total (complete)” or “Total (over target)” in words, not just colour.
The total is announced to screen readers as it updates, so nobody has to add up in their head.
Entries take up to two decimal places, and totals are compared to the cent, so 33.33 + 33.33 + 33.34 reaches 100.
On a required question, Next waits until the points match the total, and the server checks again before saving.
Constant sum, its running total, the Results chart and CSV and Excel exports are on every plan, Free included.
The total and its messages come in six languages, and your items translate with the rest of the survey.
When to use it
“You have 100 points. Share them across these five things according to how much each matters when you choose a mobile phone plan. Type 0 for any that don’t matter.” Monthly price · Network coverage · Data allowance · Contract length · Customer service
Accessibility
Each item’s box is a native number field named by its item, reachable with Tab and usable with any keyboard.
The running total is a live status, so screen readers hear it change as points go in.
“Total (complete)” and “Total (over target)” are written out, each with its own icon.
Boxes and the total follow the survey’s theme and dark mode.
Use it in
Template
MaxDiff and ranking on your features, then 100 points across performance, design, features and support. Needs Research Team for its MaxDiff.
Solution
Find out how much each feature matters, not just which comes first.
Solution
Weigh the drivers of choice in a category: price, quality, brand, service.
Example
100 points across monthly price, network coverage, data allowance, contract length and customer service.
A question that gives respondents a fixed number of points, often 100, to share across a list of items. Because the points are limited, people have to decide what matters more, and by how much. In Surveti each item gets a number box and a running total shows how many points are given so far.
On a required question, Next waits until the points match the total, and the server checks again before saving. Press Next with the points short or over, and the message names that total and the current one. The running total also reads “Total (over target)” as soon as they go past it.
Results averages the points each person gave each item, counting a box left blank as 0, and shows each average as a share of all the items’ averages, or the averages themselves with the # switch. The example on this page uses 200 answers.
Yes, up to two decimal places. Totals are compared to the cent, so 33.33, 33.33 and 33.34 add up to 100 exactly. Negative numbers are turned into 0.
Yes. An optional constant sum can be skipped, and it accepts points that don’t add up to the total, short or over. A soft-required one asks once first: the first Next on a blank answer, or on points that don’t add up to the total, shows a reminder, and the second Next goes on. Use required when every answer must add up.
One column per item, named after the question with a number for each item, in CSV and Excel, and in SPSS on Professional+. A box left blank is empty. There’s no separate column for each respondent’s total.
Constant sum is Free on every plan, with the running total, the Results chart and CSV and Excel exports. SPSS export is on Professional+.
Put items in order, when order is all you need. Free.
Best and worst from sets, for long lists. Research Team.
Each item rated on its own. Free.