Results & Analysis
Understanding Statistical Significance Badges in Crosstab Cells
Read the significance letters in crosstab cells to tell real differences between groups from random noise.
Overview
Read the significance letters in crosstab cells to tell real differences between groups from random noise — so you only report findings the data actually supports.
Step-by-step
Turn on Stats detail — at the bottom-right of the crosstab, toggle Stats detail (letters, p-values).
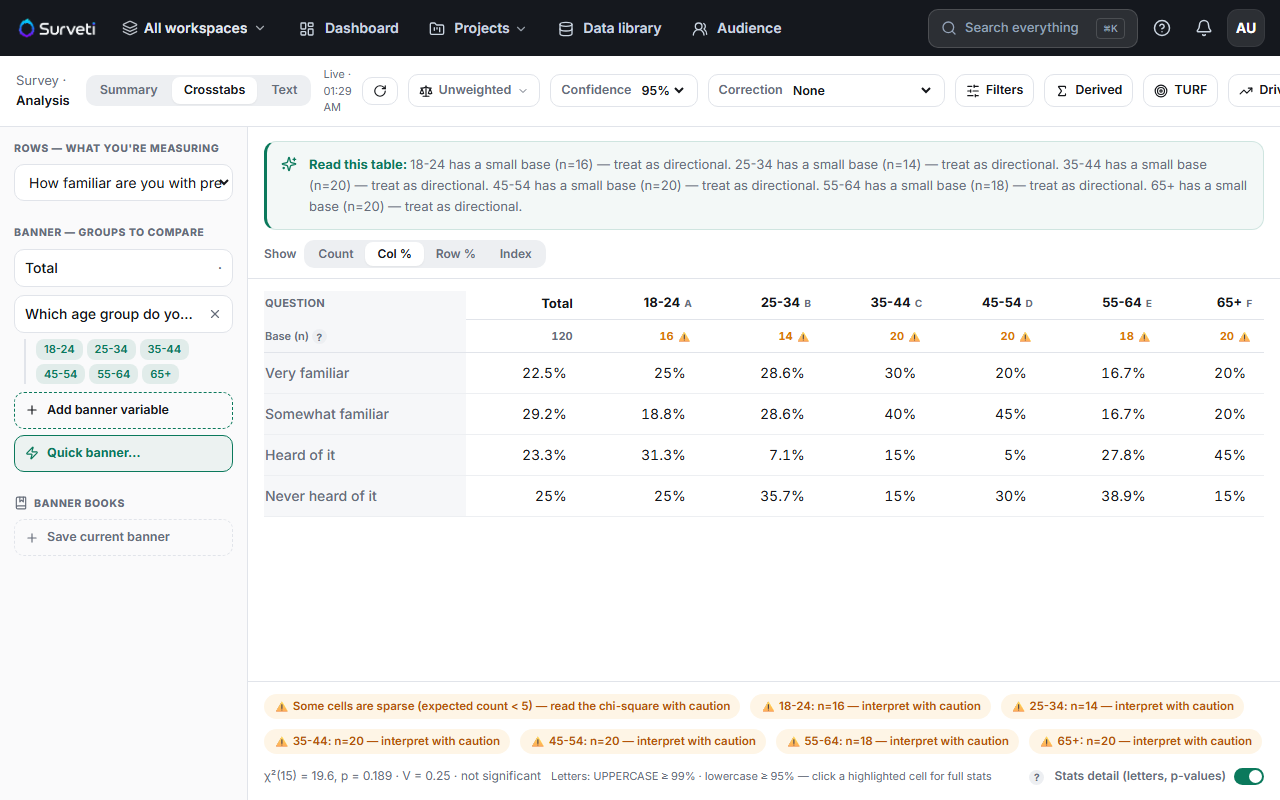
Note the column letters — each banner column gets a letter (A, B, C…) in its header. A letter inside a cell means that cell is significantly higher than the column with that letter.
Read the case — UPPERCASE ≥ 99% confidence, lowercase ≥ 95%. Uppercase is the stronger claim.
Click a highlighted cell for full stats — the popover shows the Test, Statistic, Adjusted p, Bases, Effect size, and any Overlap.
Check the table-level test — the footer reports the overall test (e.g. χ²(15) = 19.6, p = 0.189 · V = 0.25 · not significant), telling you whether any differences exist at all.
Key options
| Control | What it does |
|---|---|
| Confidence | The threshold for significance (default 95%) |
| Correction | None, FDR (recommended), or Bonferroni — adjusts for testing many cells at once |
Tips
Tip: Use FDR correction when scanning a big table. Testing dozens of cells at 95% means roughly 1 in 20 "findings" is luck; FDR keeps false positives in check without being as brutal as Bonferroni.
Note: If the table-level test says not significant, be very cautious about individual cell letters — you're likely looking at noise. And significance isn't importance: with a big base, a trivial 2-point gap can be "significant" yet mean nothing.
Related articles
- Adding and Removing Banner Variables in the Crosstab Workspace — the lettered columns
- Switching the Metric Between Count and Column Percentage in a Crosstab — what's being compared