Results & Analysis
Switching the Metric Between Count and Column Percentage in a Crosstab
Change what each crosstab cell shows — Count, Col %, Row %, or Index — to answer different questions from one table.
Overview
Change what each crosstab cell shows — Count, Col %, Row %, or Index — to answer different questions from the same table.
Step-by-step
Find the Show toggle — above the crosstab table, the Show row offers Count | Col % | Row % | Index.
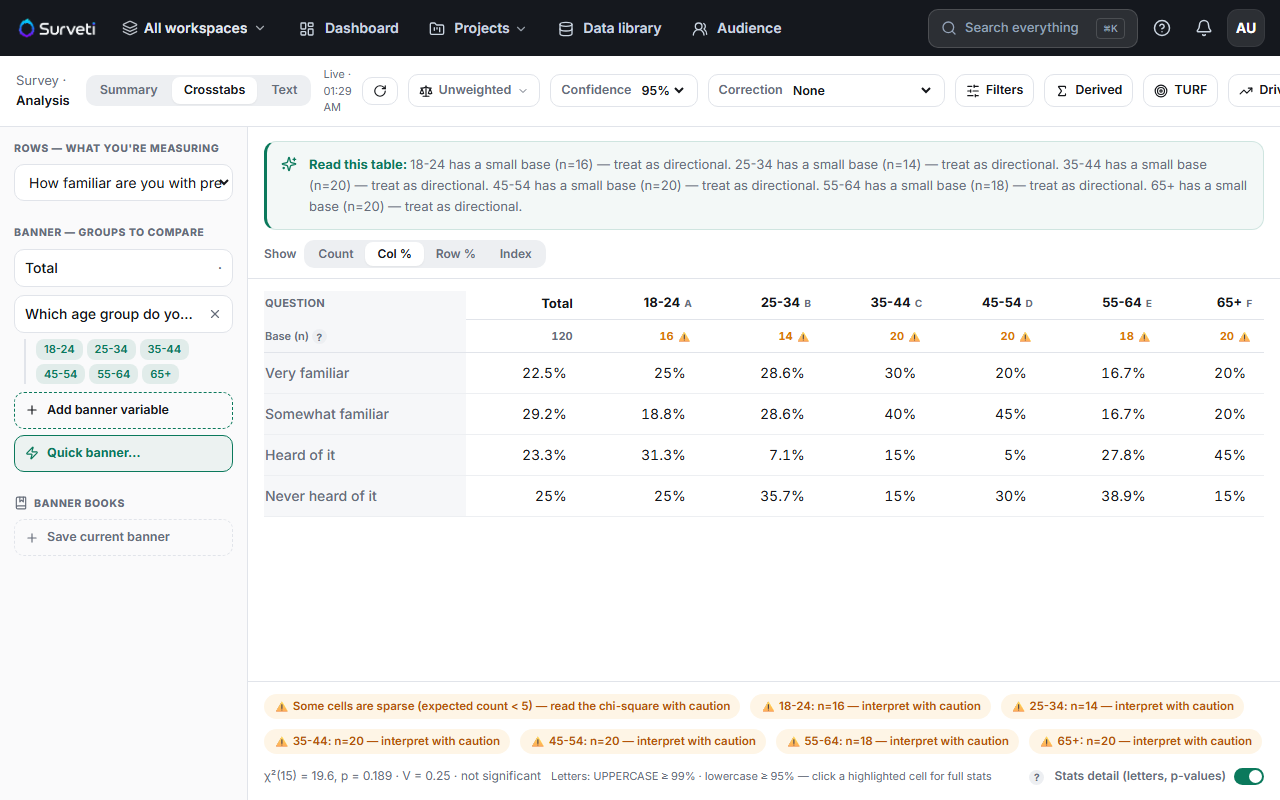
Click a metric — the table re-renders instantly. Col % is the default and the usual starting point.
Read against the base — percentages are computed against each column's Base (n), shown at the top of the table.
Key options
| Metric | Each cell shows | Answers |
|---|---|---|
| Count | Raw number of respondents | "How many people?" |
| Col % | % of that column's base | "What share of this group chose this?" |
| Row % | % of that row's total | "Of everyone who chose this, which group are they?" |
| Index | Over/under-representation vs the total | "Which group over-indexes here?" |
Tips
Tip: Col % is right for almost every comparison you'll make — "45% of 45-54s vs 18% of 18-24s" is the classic crosstab read. Reach for Row % only when your question is genuinely about composition.
Note: Col % and Row % answer different questions and are easy to confuse. If a finding sounds strange, check which metric is selected before you believe it.
Related articles
- Building Your First Cross-Tabulation Table — build the table first
- Understanding Statistical Significance Badges in Crosstab Cells — is the gap real?