Results & Analysis
Reading Your Survey Results Dashboard at a Glance
Understand what the results dashboard shows — a live summary card per question, auto-refreshing as responses arrive.
Overview
Understand what the results dashboard shows — a live summary card per question, auto-refreshing as responses arrive. It's your first look at the data while fieldwork is still running.
Step-by-step
Open the Results tab — in the builder's top tabs, click Results.
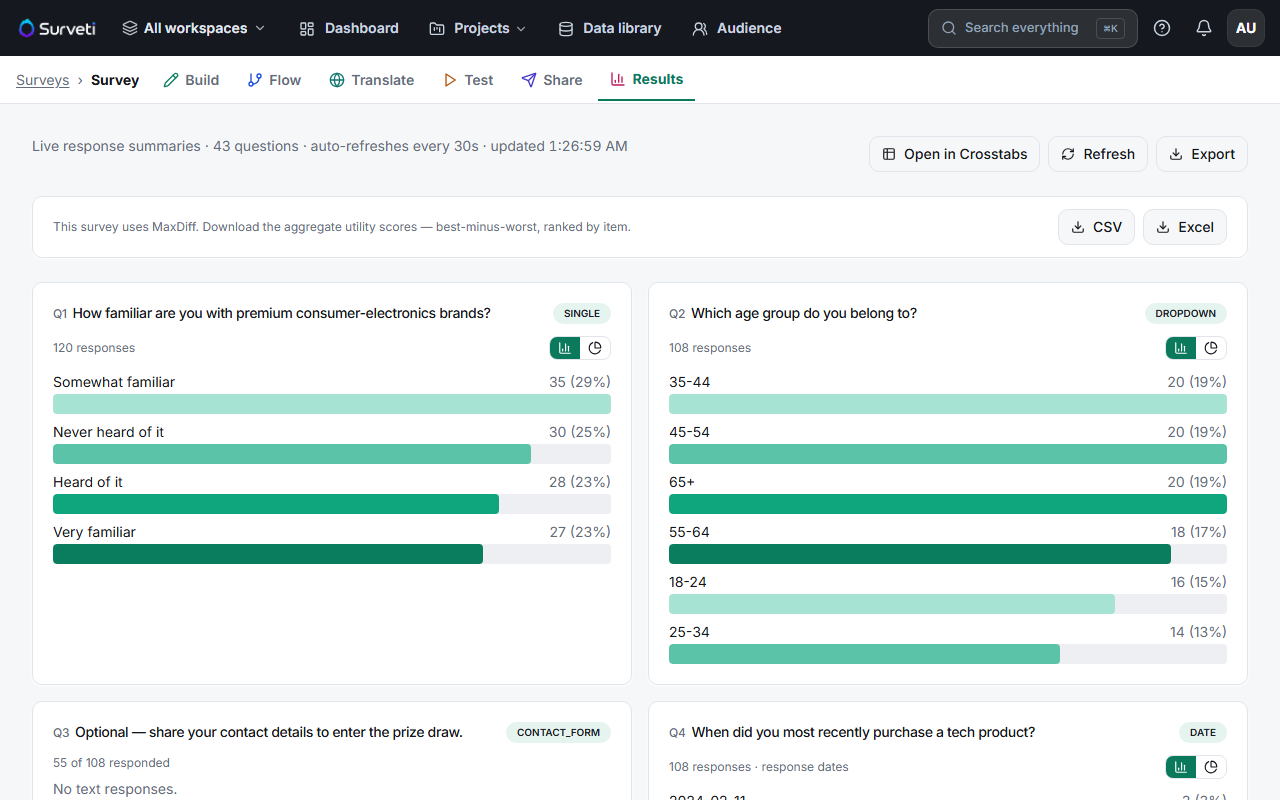
Read the header — it tells you how many questions are summarized, that summaries auto-refresh every 30 seconds, and when they last updated. Refresh forces an update; Export downloads the data.
Read each question card — every card shows the question number, its type chip (SINGLE, NPS, SCALE…), the response count, and a chart of the answers.
Go deeper — Open in Crosstabs takes the data into the analysis workspace where you can compare groups.
Tips
Tip: Response counts differ between cards — that's normal. Skipped questions, display logic, and screen-outs all mean fewer people reach later questions.
Note: Card summaries load per question as you scroll. If a card briefly says it couldn't load a summary, hit Refresh — it's fetching, not broken.
Related articles
- Switching Between Bar and Pie Chart Views on Choice Questions — change how a card renders
- Building Your First Cross-Tabulation Table — compare groups
- Exporting Survey Responses as a Flat CSV File — take the data elsewhere