Results & Analysis
Interpreting Mean and Distribution Charts for Rating Scale Questions
Read a scale question's card — the mean, min, and max plus the distribution across every scale point.
Overview
Read a scale question's card — the mean, min, and max plus the distribution across every scale point. The mean is the summary; the distribution is the story.
Step-by-step
Open the Results tab and find your scale question card.
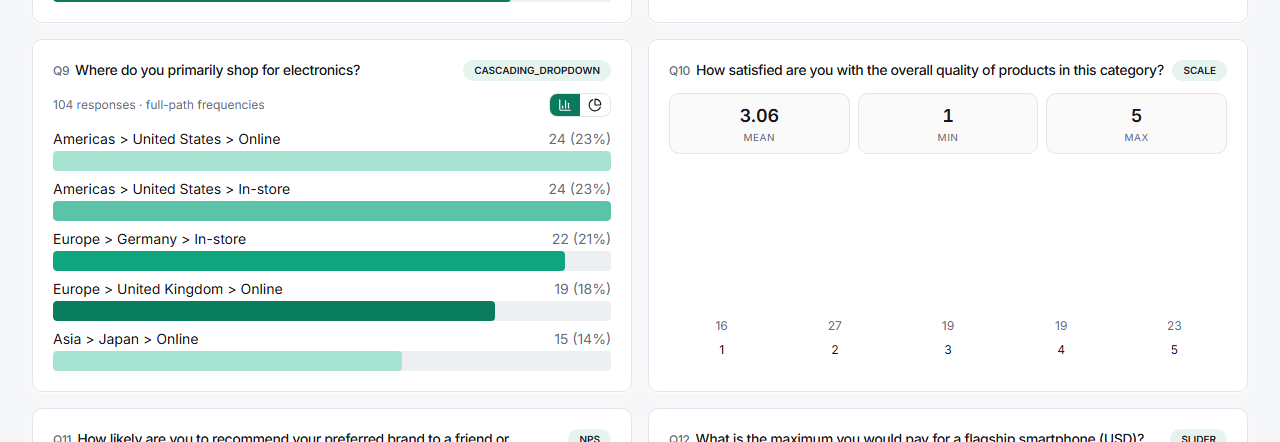
Read the summary tiles — MEAN is the average rating, MIN and MAX show the range respondents actually used.
Read the distribution — the counts under each scale point show how many people chose it. In the example, a mean of 3.06 comes from a fairly even spread (16, 27, 19, 19, 23 across points 1–5).
Compare shape, not just average — an even spread and a tight cluster around 3 give the same mean but mean very different things.
Tips
Tip: A mean near the midpoint can hide polarization. If your distribution is U-shaped — lots of 1s and lots of 5s — you have two camps, not a lukewarm middle. Crosstab by segment to find out who's who.
Note: Means are only comparable across questions that share a scale. Averaging a 1–5 satisfaction score against a 0–10 NPS is meaningless — keep scales consistent if you'll compare.
Related articles
- Adding Low Mid and High Anchor Labels to a Likert Scale — what the points mean
- Building Your First Cross-Tabulation Table — split the distribution by group
- Adding Top-2-Box and Bottom-2-Box Net Rows to a Crosstab Table — summarize the top of the scale