Results & Analysis
How the Net Promoter Score Is Calculated from Survey Responses
Updated
Understand exactly how your NPS number is derived from 0–10 answers, and what it does and doesn't tell you.
All Results & Analysis articles
Overview
Understand exactly how your NPS number is derived from 0–10 answers, and what it does and doesn't tell you.
The calculation
- Every respondent lands in a segment by their 0–10 answer: 0–6 Detractors, 7–8 Passives, 9–10 Promoters.
- Each segment becomes a percentage of everyone who answered.
- NPS = % Promoters − % Detractors. Passives are excluded from the subtraction — they only dilute the percentages.
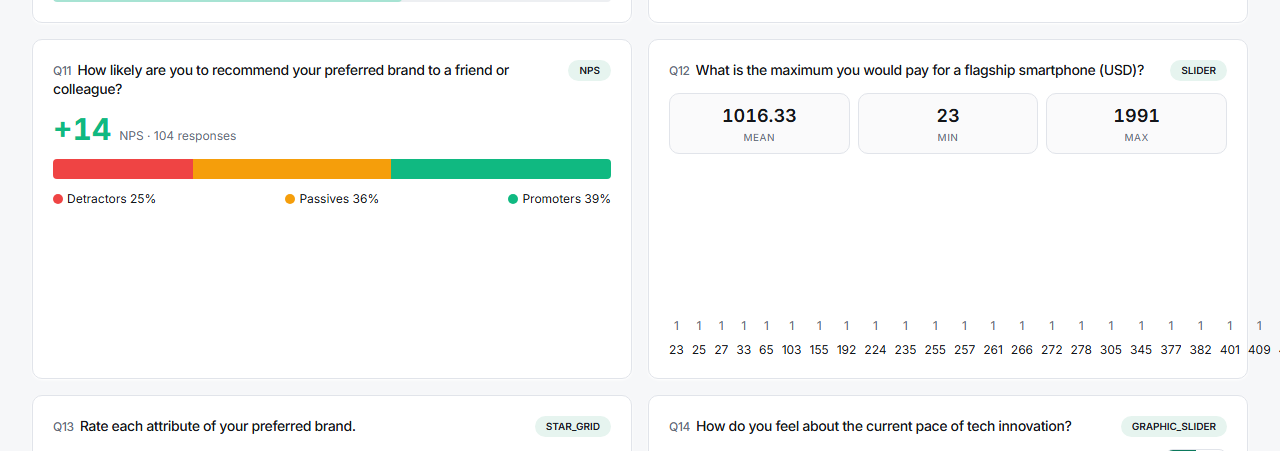
Worked from the demo survey: 39% promoters − 25% detractors = +14, with 36% passive.
What the number means
- Range: −100 (everyone a detractor) to +100 (everyone a promoter).
- It's a net, not an average. Averaging the 0–10 scores gives a different, unrelated number.
- It's deliberately harsh. A 7 — a decent score in most people's minds — counts for nothing.
Tips
Tip: Report NPS with its base and segments, never alone. "+14 (n=104; 39/36/25)" is honest; "+14" invites comparison to benchmarks collected under totally different conditions.
Note: Two very different distributions can produce the same NPS. Polarized (lots of 10s and lots of 3s) and lukewarm (everyone at 7–9) can both net out similar — always look at the segment split.
Related articles
- Reading the NPS Score Card with Promoter and Detractor Segments — reading the card
- Setting Up a Net Promoter Score Question — asking it correctly
- Adding Conditional Follow-Up Prompts by NPS Respondent Segment — the "why" behind the score