Results & Analysis
Filtering Crosstab Results to Clean Respondents Only
Apply filters so your crosstab reflects only the respondents you want to analyze — completes, clean records, or a segment.
Overview
Apply filters so your crosstab reflects only the respondents you want to analyze — completes only, clean (non-flagged) records, or any segment you define.
Step-by-step
Open the Filters control — in the Crosstabs workspace toolbar, click Filters.
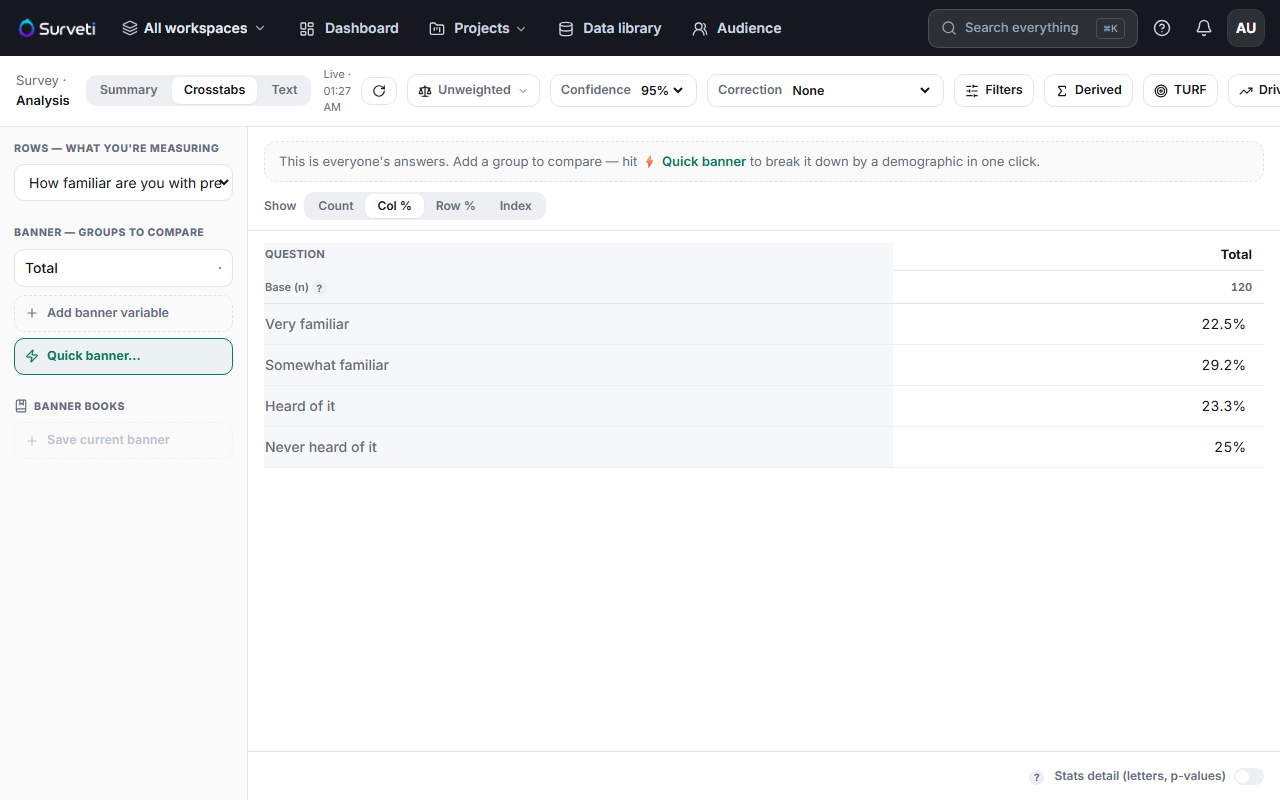
Choose your criteria — filter by respondent status (completes vs partials), quality (exclude flagged), or by any answer to define a segment.
Confirm the base changed — after filtering, the Base (n) at the top of each column drops to the filtered count. That number is your evidence the filter applied.
Keep it consistent — use the same filter across every table in an analysis, or your numbers won't reconcile between slides.
Tips
Tip: State your filter in the report. "Base: completes only, fraud-flagged excluded (n=104)" is what makes a table defensible six months later when nobody remembers how it was cut.
Note: Filtering shrinks your base, and small bases make percentages jumpy. If a filter drops a column under ~30 respondents, treat its numbers as directional.
Related articles
- Excluding Fraud-Flagged Responses from Analysis and Exports — quality filtering in detail
- Building Your First Cross-Tabulation Table — the table you're filtering