Results & Analysis
Building Your First Cross-Tabulation Table
Break one question's answers down by another — the core move of survey analysis — in the Crosstabs workspace.
Overview
Break one question's answers down by another — the core move of survey analysis. A crosstab turns "29% are somewhat familiar" into "which age groups drive that?".
Step-by-step
Open the Crosstabs workspace — from the Results tab click Open in Crosstabs, or go to the survey's Analysis view and pick the Crosstabs tab.
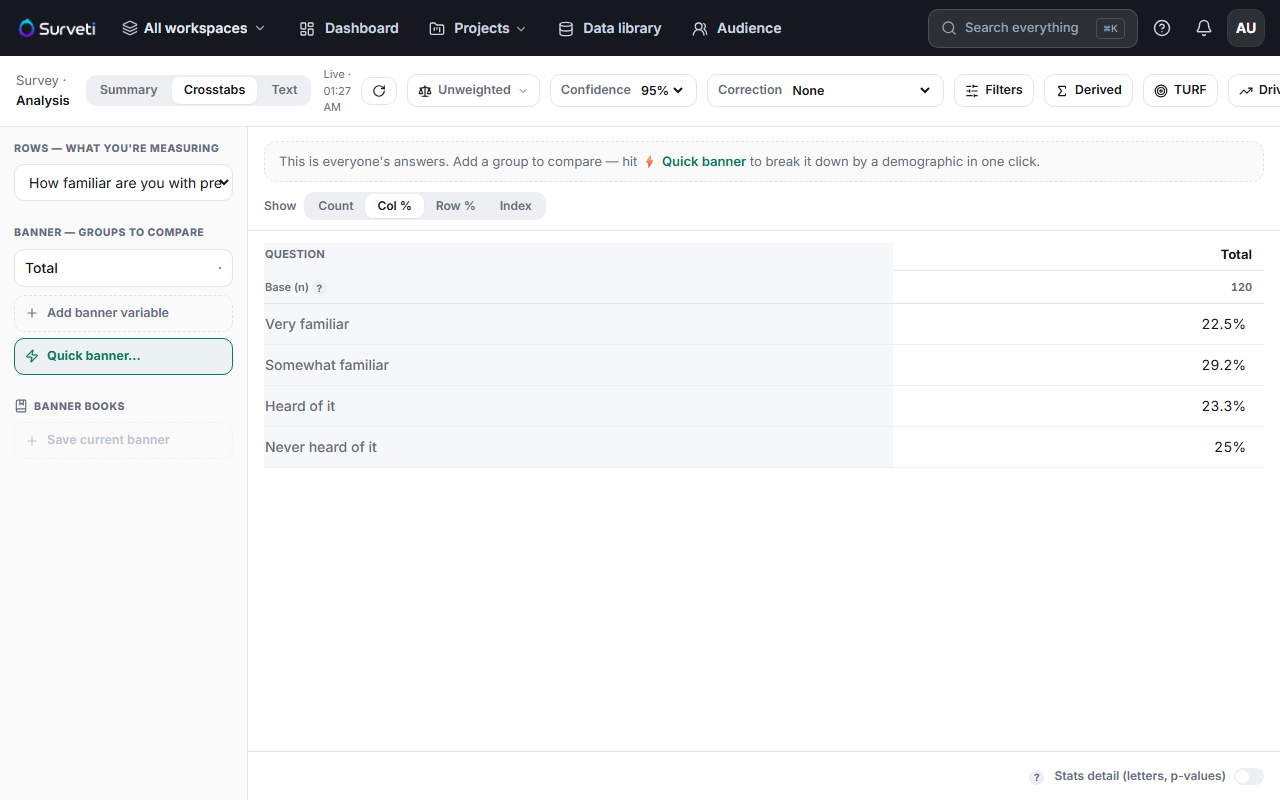
Choose your rows — under ROWS — WHAT YOU'RE MEASURING, pick the question you want to analyze. Its answers become the table's rows.
Add a banner — under BANNER — GROUPS TO COMPARE, click Quick banner… to break the table down by a demographic in one click, or Add banner variable to choose any question.
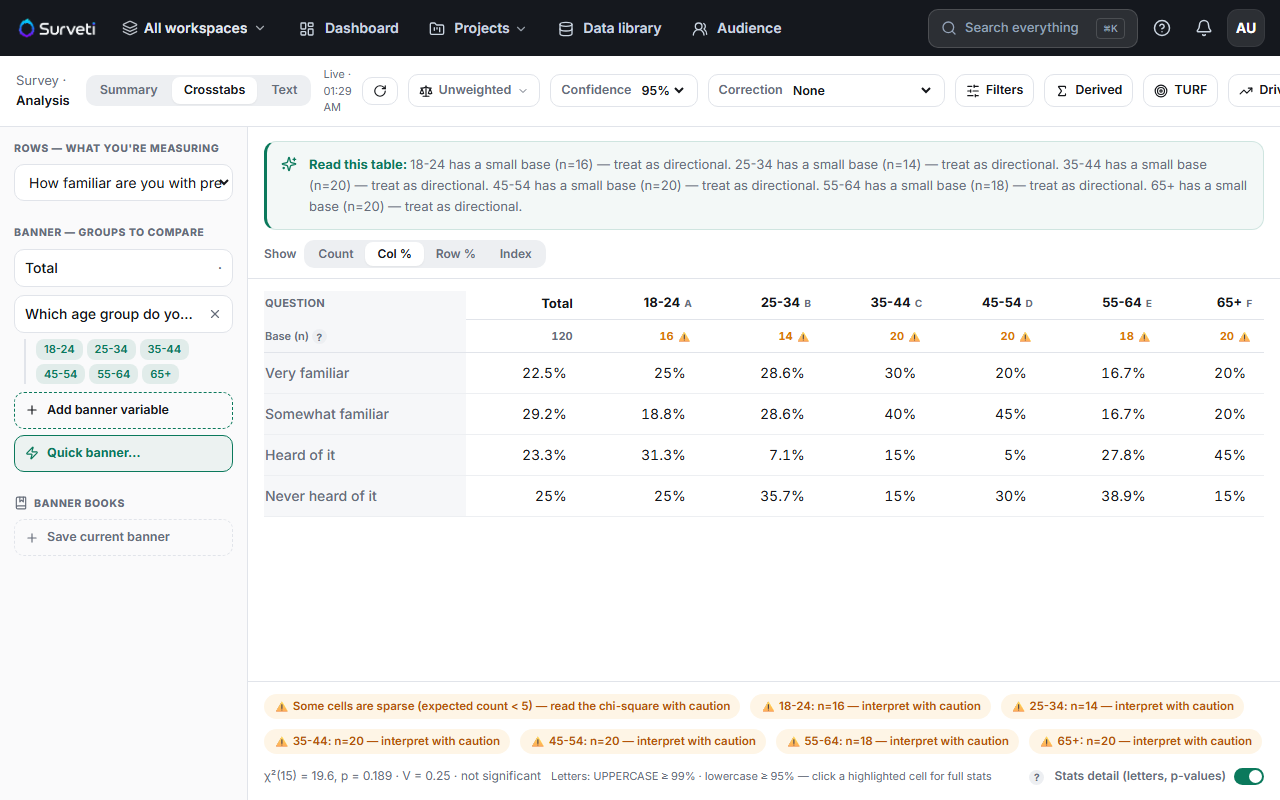
Read the table — each banner group becomes a column with its own Base (n), and each cell shows that group's answer. The Read this table callout summarizes caveats in plain English.
Tips
Tip: Start with a Total-only table to learn the overall shape, then add one banner. Piling on banner variables before you know the baseline makes it harder, not easier, to see what matters.
Note: Watch the per-column Base (n). Columns flagged with a warning have small bases — treat those percentages as directional, not precise.
Related articles
- Adding and Removing Banner Variables in the Crosstab Workspace — manage the columns
- Switching the Metric Between Count and Column Percentage in a Crosstab — what the cells show
- Understanding Statistical Significance Badges in Crosstab Cells — which differences are real