Results & Analysis
Adding Top-2-Box and Bottom-2-Box Net Rows to a Crosstab Table
Summarize a scale with net rows — combining the top or bottom two points into a single, reportable number.
Overview
Summarize a scale with net rows — combining the top or bottom two scale points into a single, reportable number. "Top-2-box" is how most stakeholders want to hear a 5-point scale.
Step-by-step
Build a crosstab on a scale question — put the scale question in ROWS and a banner in the columns.
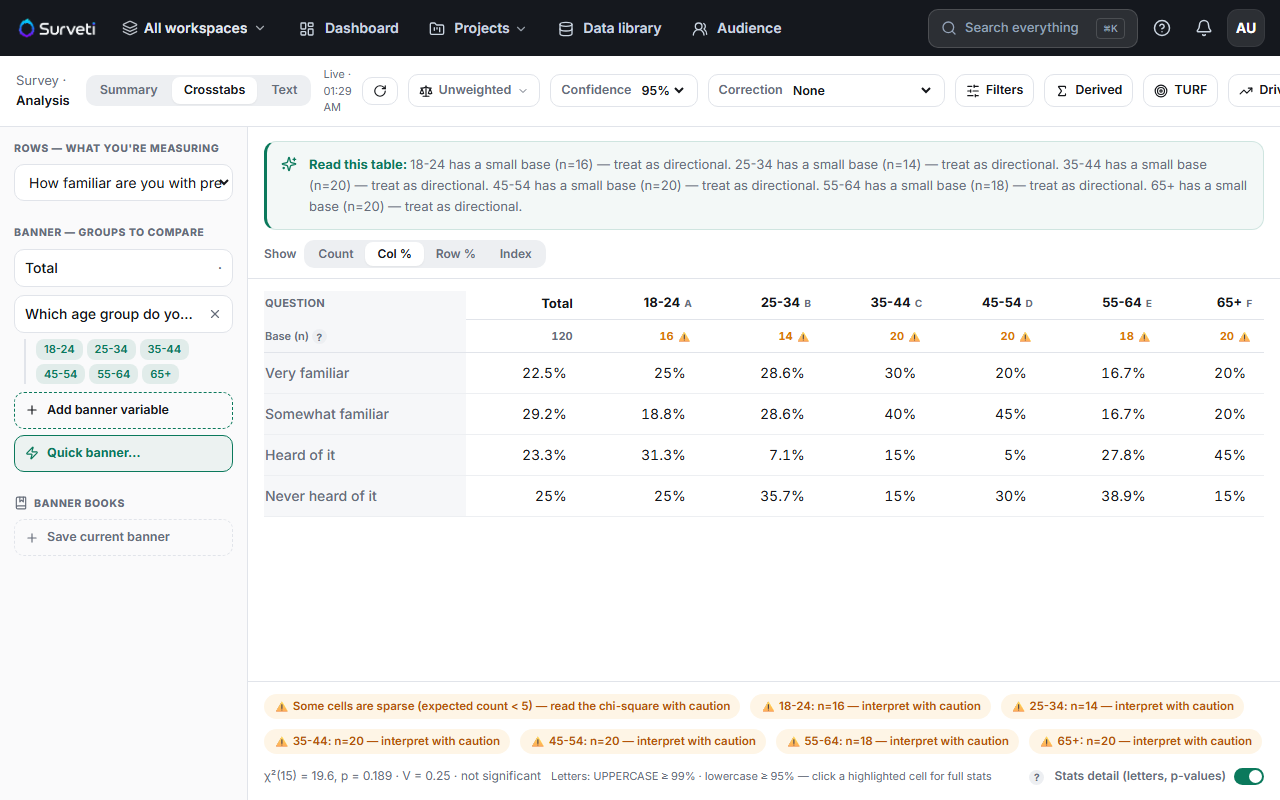
Add a net row — add a Top-2 net to combine the two most positive points (e.g. Agree + Strongly agree) into one row, and a bottom-2 net for the negative end.
Read the net across the banner — the net row shows each group's top-2-box percentage, which is usually the number that goes in the report.
Check significance on the net — with Stats detail on, the net row gets significance letters too, so you can say which groups are genuinely more positive.
Tips
Tip: Report the net, keep the detail. Top-2-box gives stakeholders a single comparable number; the underlying distribution tells you whether it's driven by enthusiasm (lots of 5s) or mild agreement (lots of 4s).
Note: Nets only make sense on ordered scales. Combining the top two options of an unordered choice question ("Designer" + "Engineer") produces a number with no meaning.
Related articles
- Interpreting Mean and Distribution Charts for Rating Scale Questions — the distribution behind the net
- Understanding Statistical Significance Badges in Crosstab Cells — testing the net