Results & Analysis
Adding and Removing Banner Variables in the Crosstab Workspace
Control which groups appear as columns in your crosstab, and save a banner you'll reuse across tables.
Overview
Control which groups appear as columns in your crosstab, and save a banner you'll reuse across tables. The banner is the "compare by" side of the table.
Step-by-step
Open the banner rail — in the Crosstabs workspace, find BANNER — GROUPS TO COMPARE on the left.
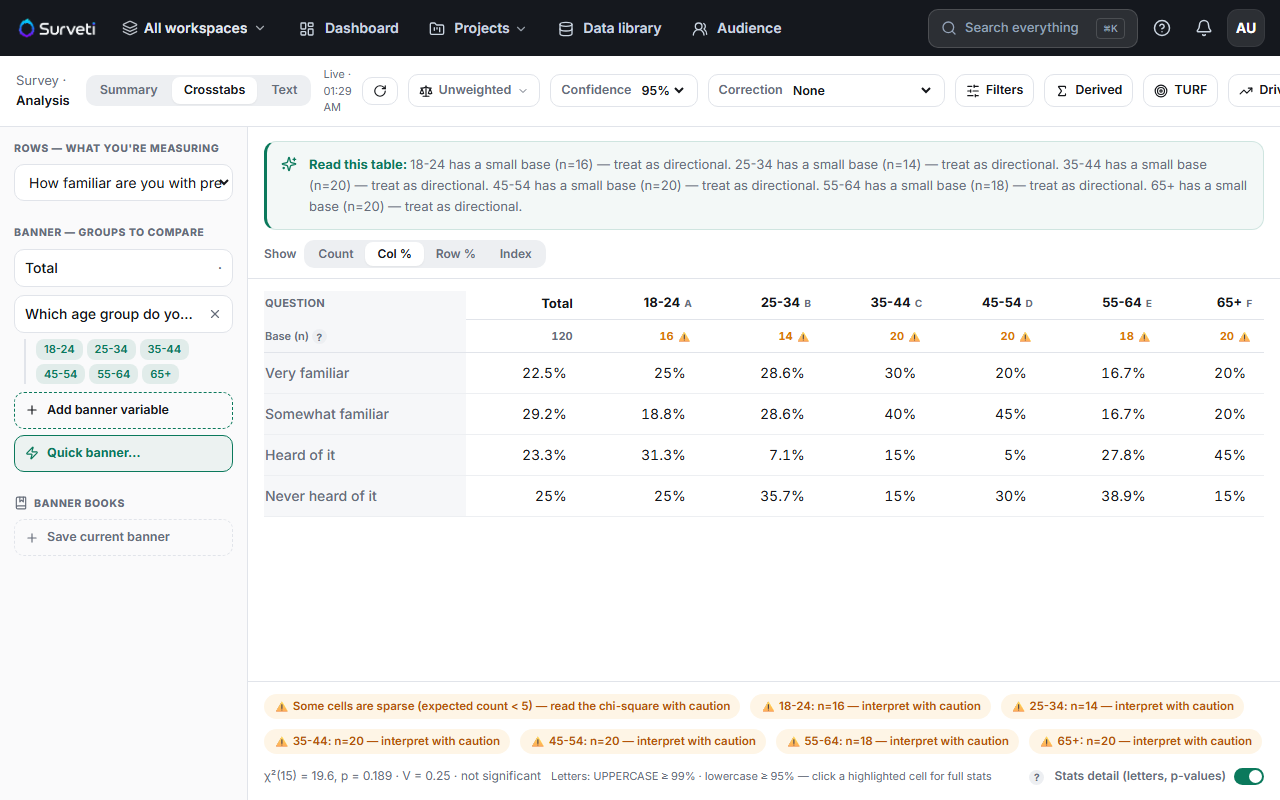
Add a variable quickly — click Quick banner… to pick a demographic in one click. Each of its answers becomes a column.
Add any question as a banner — click + Add banner variable to choose any question in the survey, not just demographics.
Remove a variable — click the × on the banner chip to drop it. Total always remains as the baseline column.
Save a banner book — under BANNER BOOKS, click Save current banner to reuse the same column set on other tables.
Tips
Tip: Save your standard banner (age × gender × region, or whatever your team always cuts by) as a banner book once. Every future table starts consistent, and your deck stops drifting between charts.
Note: Every banner column splits your sample further. A 120-response survey cut by six age groups leaves ~20 per column — enough to see direction, not enough for confident precision.
Related articles
- Building Your First Cross-Tabulation Table — the basics
- Understanding Statistical Significance Badges in Crosstab Cells — reading the columns
- Filtering Crosstab Results to Clean Respondents Only — narrow the base