Getting Started
Understanding the Surveti Dashboard Layout
Learn what each area of the Surveti dashboard does — the top navigation, project cards, and plan usage — so you can find your way around quickly.
Overview
Learn what each area of the Surveti dashboard does — the top navigation, project cards, and plan usage — so you can find your way around quickly. The dashboard is the first page you see after signing in.
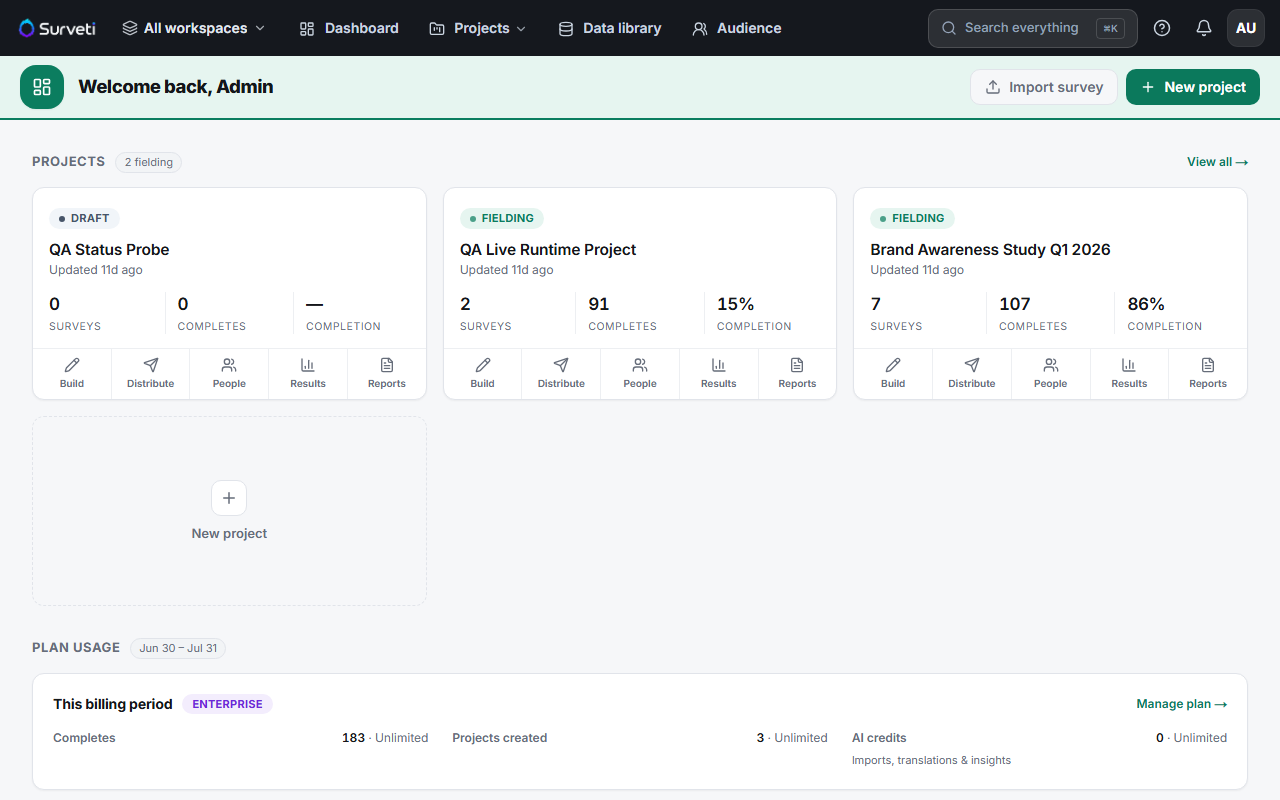
The top navigation bar
- Workspace switcher — next to the Surveti logo; switch between workspaces if your organization has more than one.
- Dashboard — returns you to this home page from anywhere.
- Projects — your projects and the surveys inside them.
- Data library — reusable assets shared across surveys.
- Audience — contact lists for email distribution.
- Search everything (⌘K / Ctrl+K) — jump to any survey, project, or page by name.
- On the far right: the help icon, notifications, and your avatar menu (settings and sign-out).
Project cards
Each card in the Projects section is one project, with:
- A status chip — Draft or Fielding — so you can see what's collecting responses at a glance.
- Live counts of surveys, completes, and completion rate.
- Quick actions: Build, Distribute, People, Results, and Reports take you straight to that part of the project.
Use + New project (top right or the dashed card) to add another project, or Import survey to bring in an existing questionnaire.
Plan usage
The Plan usage section at the bottom shows this billing period's consumption — completes, projects created, and AI credits — against your plan's limits, with a Manage plan link to the billing page.
Tips
Tip: The search bar is the fastest way to move around once you have more than a few surveys — press ⌘K (Mac) or Ctrl+K (Windows) from any page.
Related articles
- How to Create a New Project — start organizing your work
- Creating Your First Survey from Scratch — from dashboard to builder
- Understanding Monthly Response Limits by Plan — what the usage numbers mean