Advanced Research
Running MNL Utility Estimation on Conjoint Response Data
Surveti fits aggregate multinomial-logit utilities to your conjoint data automatically — here's what it runs and how to read the fit stats.
Overview
Surveti fits aggregate multinomial-logit (MNL) utilities to your conjoint data automatically — no button to press, no export to a stats package. This article explains what it runs and how to read the fit statistics.
Step-by-step
Field the conjoint question — respondents complete their choice tasks.
Open the Results tab and scroll to the conjoint question card.
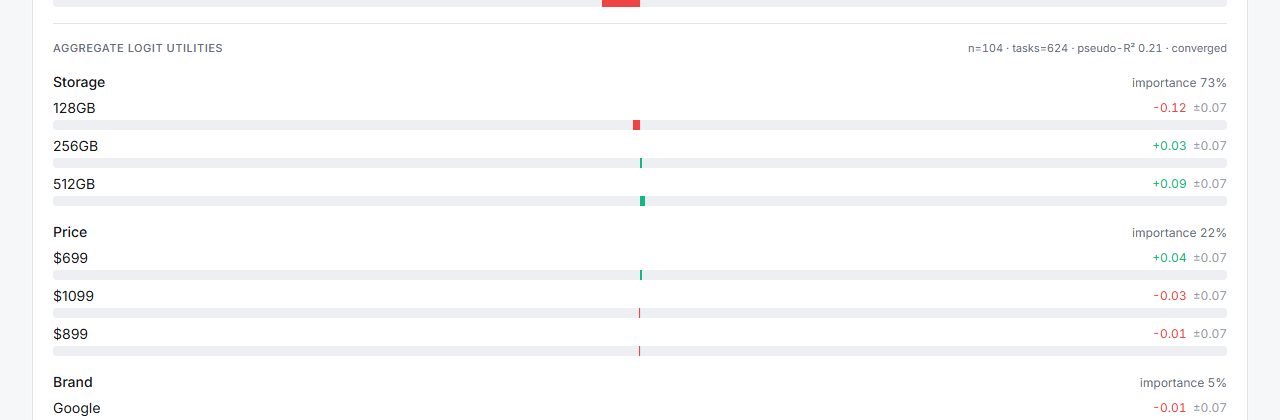
Read the fit line — under AGGREGATE LOGIT UTILITIES you get
n=104 · tasks=624 · pseudo-R² 0.21 · converged.Check convergence first — if it doesn't say converged, don't interpret the numbers.
What the fit stats mean
| Stat | Meaning |
|---|---|
| n | Respondents included in the fit |
| tasks | Answered choice tasks used (the real sample size for estimation) |
| pseudo-R² | McFadden's R² — model fit; 0.2–0.4 is generally considered a good fit for choice models |
| converged | The estimator found a stable solution |
How the model works
Each task is treated as a conditional-logit choice among the cards actually shown (plus "none" when the design offers it). Attributes are effects-coded, so utilities are zero-centered within each attribute by construction. Estimation is penalized maximum likelihood via Newton–Raphson with a small ridge, which keeps it stable even when a level is always chosen.
Tips
Tip: Don't read McFadden's pseudo-R² like an OLS R². 0.21 is a respectable choice-model fit — it is not "only 21% explained". Values above ~0.4 are excellent.
Note: This is an aggregate fit — one set of utilities for the whole sample, honestly labeled "aggregate logit utilities". It is not hierarchical Bayes (individual-level utilities), which is a planned follow-up. Aggregate utilities can hide real segment differences: crosstab your key questions to check whether segments actually differ.
Related articles
- Interpreting Part-Worth Utilities from MNL Output — reading the numbers
- Understanding Attribute Importance Scores in Conjoint Analysis — importance
- Running a Share-of-Preference Simulation with Conjoint Results — using the fit